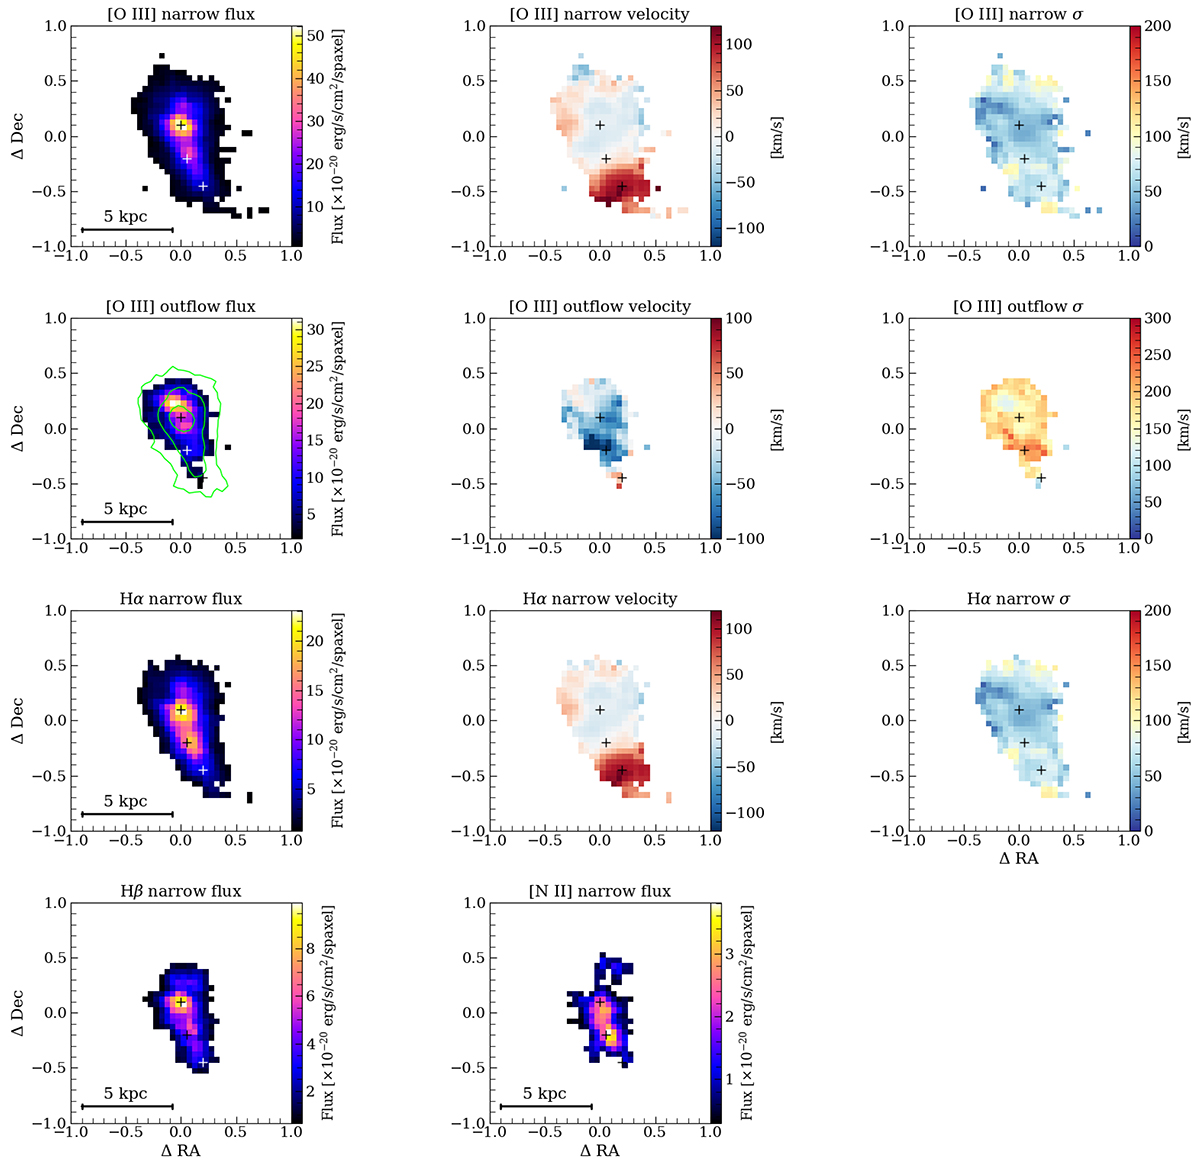
Fig. 6.
Download original image
Results for the spaxel-by-spaxel fitting of the R2700 cube. In the first row, we show from left to right the [O III]λ5007 Å flux, velocity, and velocity dispersion maps of the narrow component, respectively. In the second row, we show the same but for the [O III] broad component. In the [O III] broad flux map, we show the 5, 25, and 75σ contours of the narrow [O III] flux in green. In the third row we show from left to right the Hα flux, velocity, and velocity dispersion maps of the narrow component, respectively. In the bottom panels, we show from left to right the flux maps of the Hβ, and [N II]λ6584 Å narrow components, respectively. The plus signs show the location of the three components identified in Figs. 4 and 5.
Current usage metrics show cumulative count of Article Views (full-text article views including HTML views, PDF and ePub downloads, according to the available data) and Abstracts Views on Vision4Press platform.
Data correspond to usage on the plateform after 2015. The current usage metrics is available 48-96 hours after online publication and is updated daily on week days.
Initial download of the metrics may take a while.