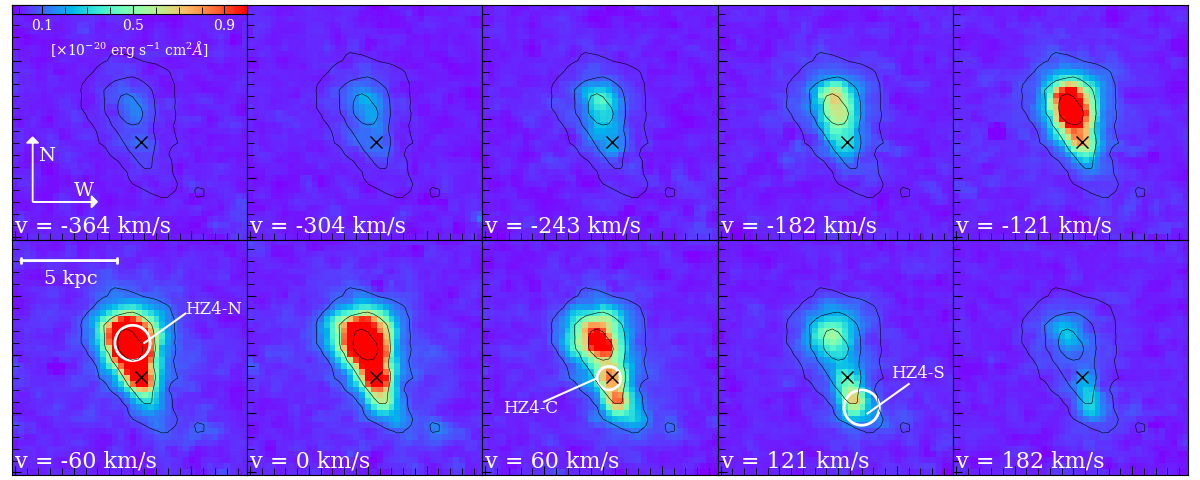
Fig. 4.
Download original image
Channel maps from the R2700 cube targeting the [O III]λ5007 Å emission line. Black lines are the contour of the 5, 25, and 75 times the RMS level computed in the line-free regions of the cube for the emission at v = 0. The velocity marks the central velocity of the channel. The black cross shows the location of the [C II] emission peak (see Fig. 1). The white circles represent the position of the components of HZ4.
Current usage metrics show cumulative count of Article Views (full-text article views including HTML views, PDF and ePub downloads, according to the available data) and Abstracts Views on Vision4Press platform.
Data correspond to usage on the plateform after 2015. The current usage metrics is available 48-96 hours after online publication and is updated daily on week days.
Initial download of the metrics may take a while.