Open Access
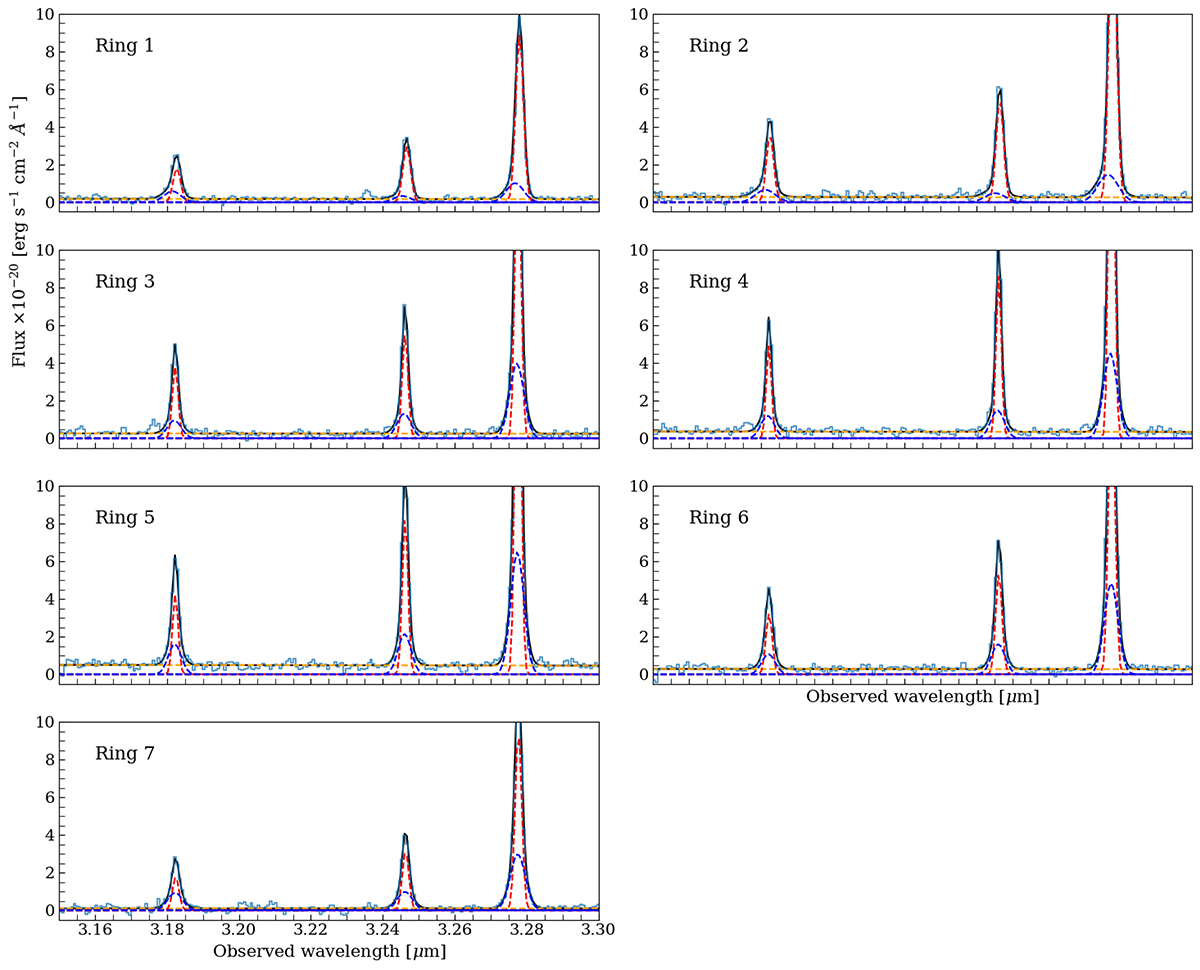
Fig. C.1.
Download original image
Zoom in on the [O III] and Hβ complex of each ring. Red and blue dashed lines are the narrow and outflow best-fit models. Please note that the displayed range on the y axis is the same for all the panels.
Current usage metrics show cumulative count of Article Views (full-text article views including HTML views, PDF and ePub downloads, according to the available data) and Abstracts Views on Vision4Press platform.
Data correspond to usage on the plateform after 2015. The current usage metrics is available 48-96 hours after online publication and is updated daily on week days.
Initial download of the metrics may take a while.