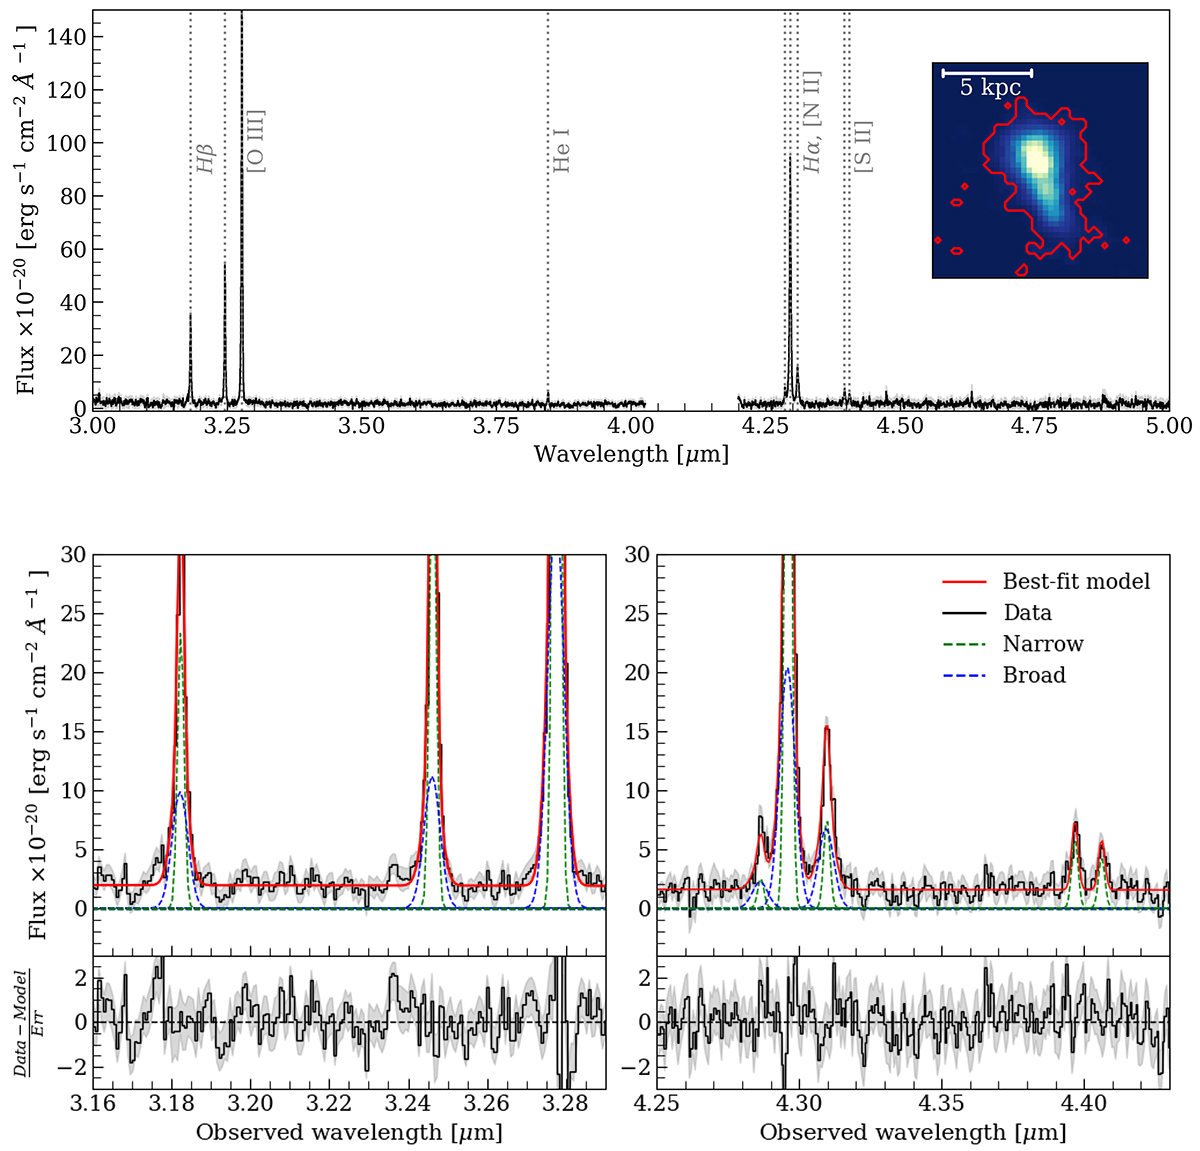
Fig. 2.
Download original image
High resolution spectrum of the source. Upper panel: Integrated spectrum of the source extracted from the regions with S/N > 3 in the wavelength range 3.27–3.29 μm encompassing the [O III]λ5007 Å emission. The extraction region is shown as the red contour in the inset panel. Bottom panels: Zoom-in on the integrated spectrum (black) and our best fit (red). The narrow and broad components are shown as the green and blue dashed lines, respectively. The Hβ and [O III] complex is shown in the left panel, and the Hα, [N II], and [S II]λλ 6717,6731 complex is shown in the right panel. The gray shaded areas mark the uncertainties on the data.
Current usage metrics show cumulative count of Article Views (full-text article views including HTML views, PDF and ePub downloads, according to the available data) and Abstracts Views on Vision4Press platform.
Data correspond to usage on the plateform after 2015. The current usage metrics is available 48-96 hours after online publication and is updated daily on week days.
Initial download of the metrics may take a while.