Fig. 13.
Download original image
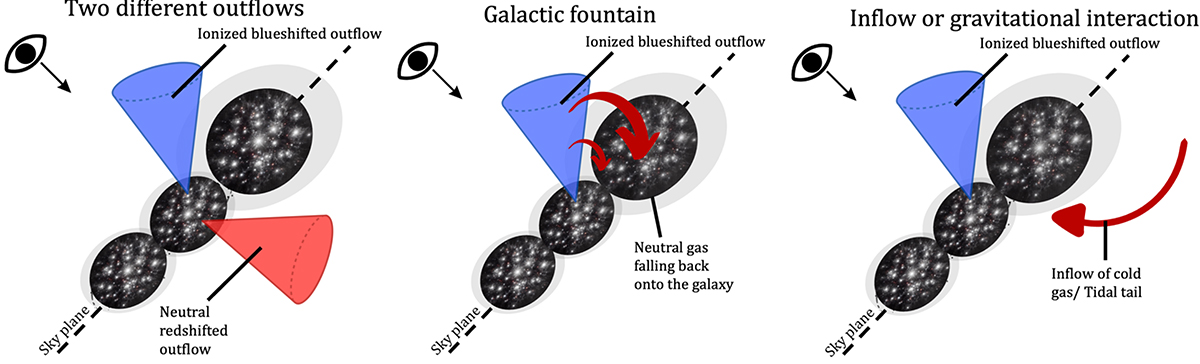
Cartoon illustrating three possible scenarios involving the presence of outflows for the explanation of the observations of the broad lines. In all panels, we draw in red the [C II] noncircular components, and in blue the ionized gas emitting the broad rest-frame optical lines. In the left panel, we represent the multiphase outflow scenario in which the ionized broad line is mainly emitted by the approaching side of the outflow launched by the SF clump. The outflow traced by the [C II] broad component is emitted by outflowing gas on the receding side. In the central panel, we show the galactic fountain scenario, in which the ionized gas is still tracing the outflow, but the [C II] emission is tracing the gas that cannot escape from the potential well of the galaxy, then it cools down and falls back onto the galaxy. The right panel instead depicts the scenario in which the redshifted [C II] emission is tracing the inflow of cold gas from the CGM or IGM onto the galaxy, or is tracing gas stripped by the outer region of the northern and southern galaxies due to gravitational interaction.
Current usage metrics show cumulative count of Article Views (full-text article views including HTML views, PDF and ePub downloads, according to the available data) and Abstracts Views on Vision4Press platform.
Data correspond to usage on the plateform after 2015. The current usage metrics is available 48-96 hours after online publication and is updated daily on week days.
Initial download of the metrics may take a while.