Fig. 12.
Download original image
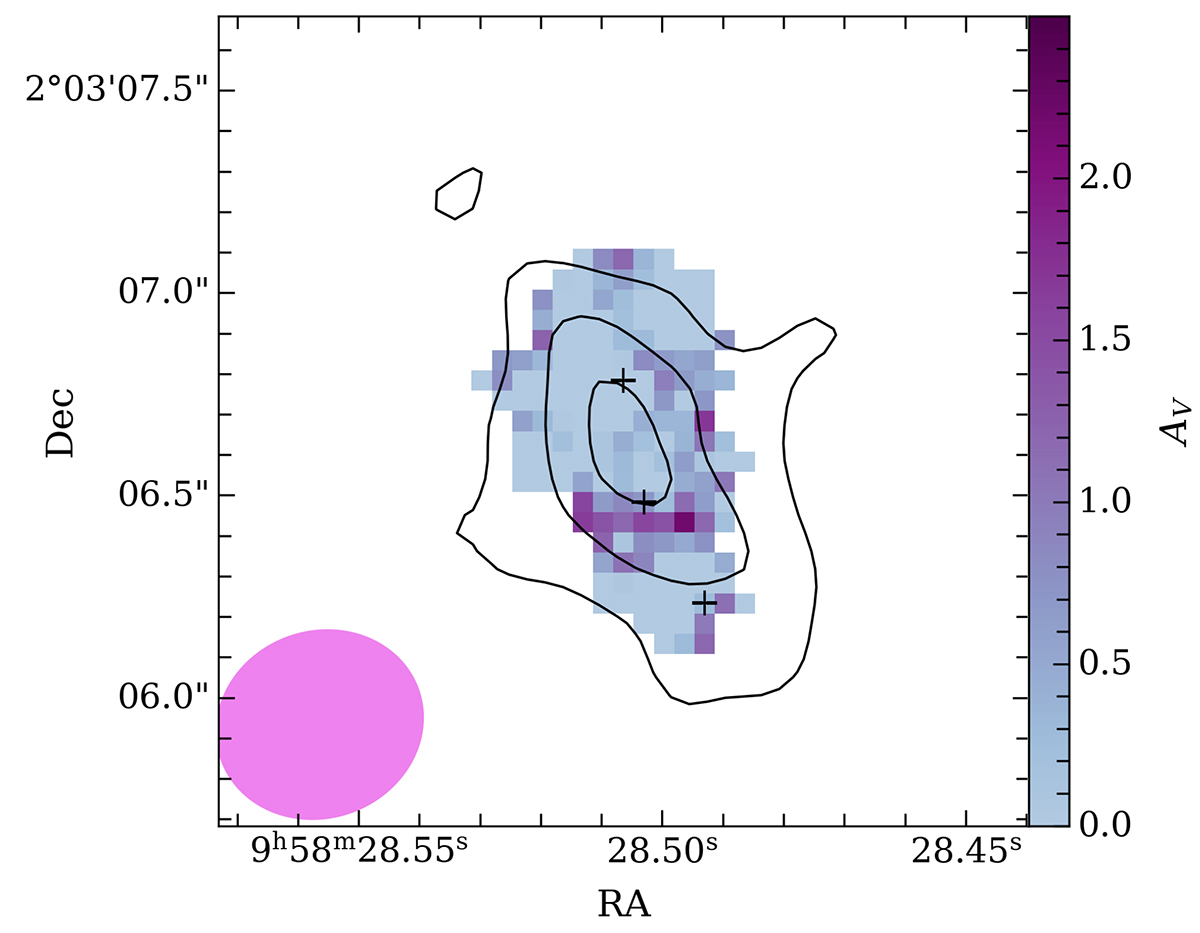
AV map from narrow component (same as in Fig. 8) and dust continuum emission contours at 160 μm rest-frame. In black we report the dust continuum 3, 6, and 8σ contours. The black plus signs represent the location of the three components identified from the [O III] channel maps and in optical continuum emission. The purple ellipse represents the beam size of the dust continuum emission.
Current usage metrics show cumulative count of Article Views (full-text article views including HTML views, PDF and ePub downloads, according to the available data) and Abstracts Views on Vision4Press platform.
Data correspond to usage on the plateform after 2015. The current usage metrics is available 48-96 hours after online publication and is updated daily on week days.
Initial download of the metrics may take a while.