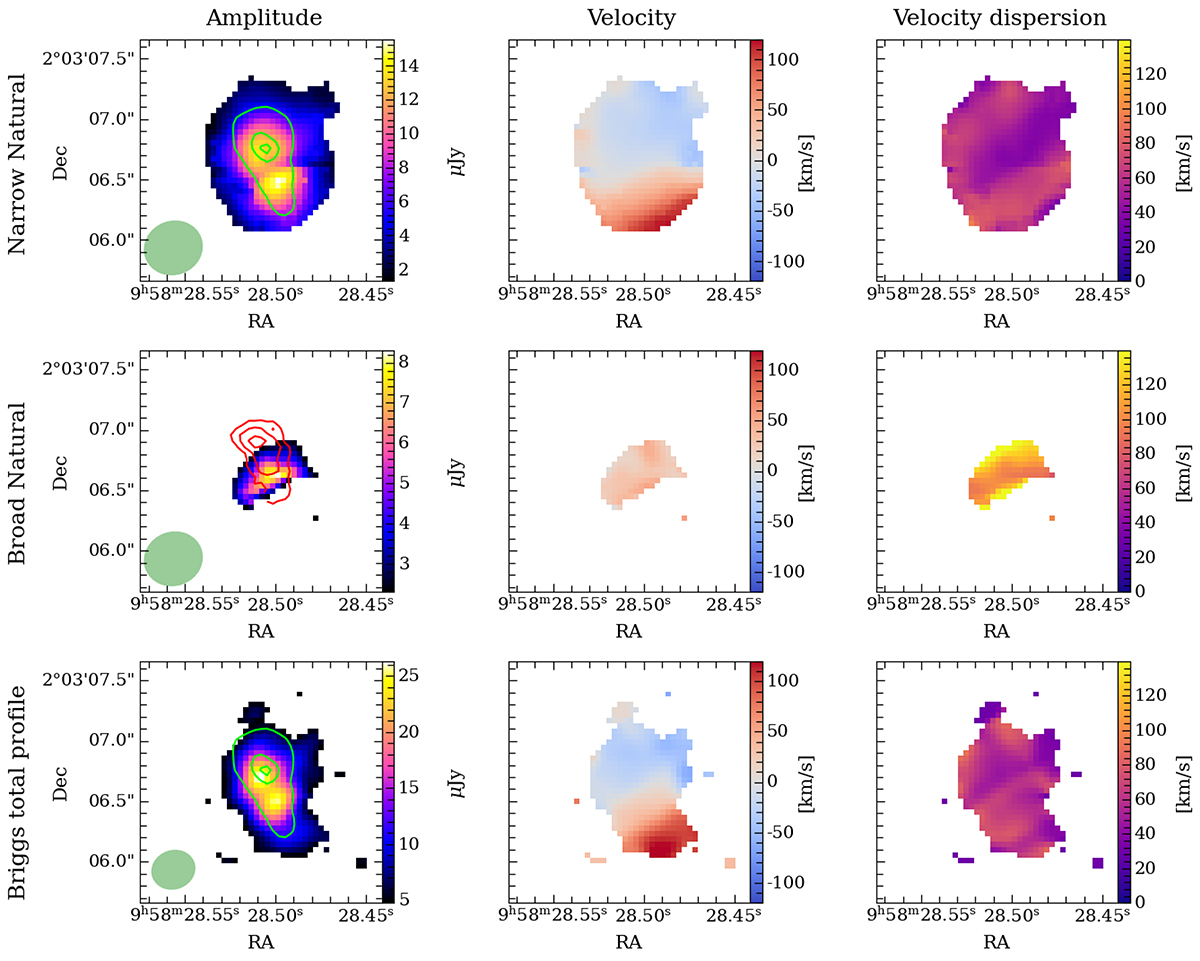
Fig. 11.
Download original image
[C II] moment maps derived from a spaxel-by-spaxel Gaussian fitting. From left to right we present the maps of the amplitude of the Gaussian, the velocity, and the velocity dispersion, respectively. From top to bottom, we show the narrow and the broad components from the natural cube and the total emission from the 1-component fit from the Briggs robust = 0.5 cube. We note that no broad components were selected from the Briggs cube because they fall below the 3σ threshold. In the left panels, we show the ALMA beam as a green ellipse and the narrow and broad [O III] flux from Fig. 6 as lime and red contours, respectively.
Current usage metrics show cumulative count of Article Views (full-text article views including HTML views, PDF and ePub downloads, according to the available data) and Abstracts Views on Vision4Press platform.
Data correspond to usage on the plateform after 2015. The current usage metrics is available 48-96 hours after online publication and is updated daily on week days.
Initial download of the metrics may take a while.