Fig. 8.
Download original image
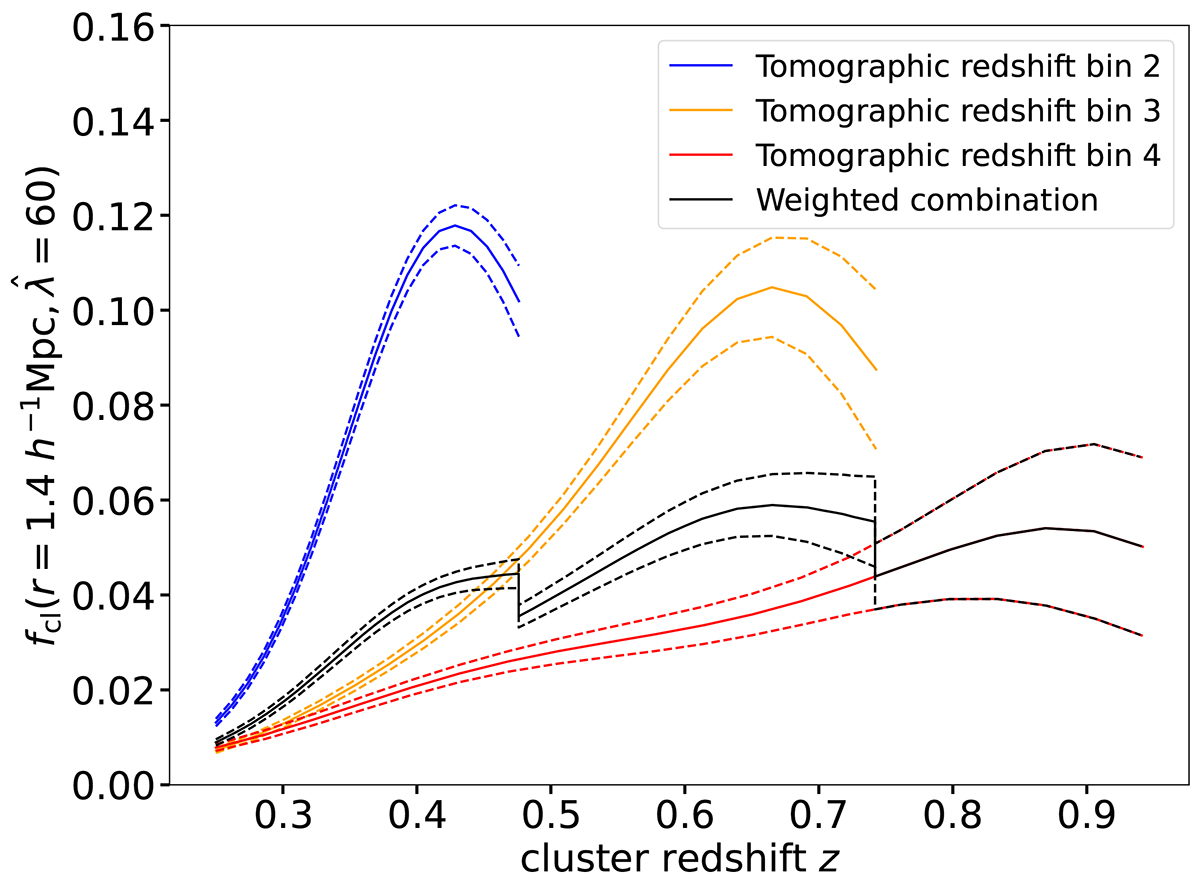
Fractional cluster member contamination for a cluster with ![]() as a function of redshift for the three source galaxy tomographic bins (see Fig. 2) and their weighted combination. The solid (dashed) lines show the mean (68% credible interval) of the contamination. The colored lines extend over the redshift ranges for which each tomographic bin is employed in constructing the cluster matter profiles. The 1.4h−1 Mpc radius is chosen because that is a characteristic radius from which the WL constraints are coming, given the adopted radial fitting range and the increasing number of source galaxies with radius.
as a function of redshift for the three source galaxy tomographic bins (see Fig. 2) and their weighted combination. The solid (dashed) lines show the mean (68% credible interval) of the contamination. The colored lines extend over the redshift ranges for which each tomographic bin is employed in constructing the cluster matter profiles. The 1.4h−1 Mpc radius is chosen because that is a characteristic radius from which the WL constraints are coming, given the adopted radial fitting range and the increasing number of source galaxies with radius.
Current usage metrics show cumulative count of Article Views (full-text article views including HTML views, PDF and ePub downloads, according to the available data) and Abstracts Views on Vision4Press platform.
Data correspond to usage on the plateform after 2015. The current usage metrics is available 48-96 hours after online publication and is updated daily on week days.
Initial download of the metrics may take a while.