Fig. 6.
Download original image
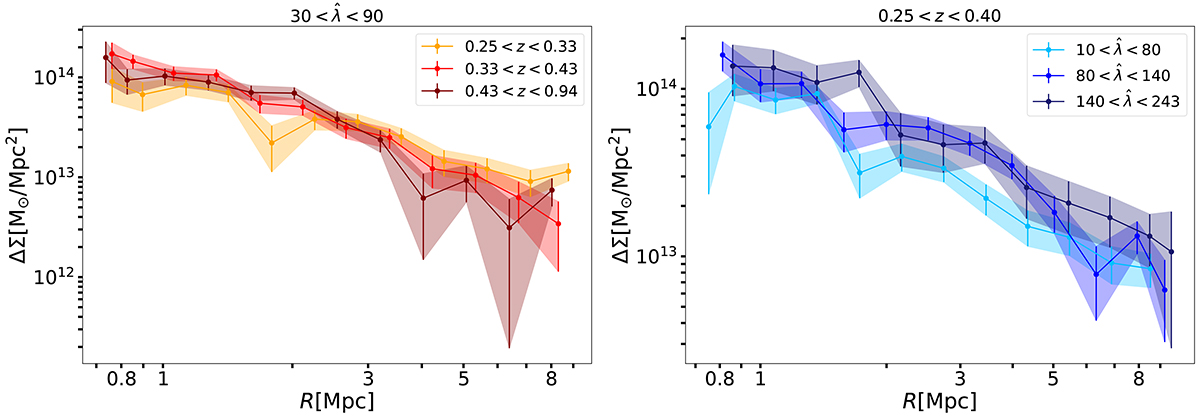
SPT cluster average matter profiles ΔΣ(R) for three redshift bins in a given richness bin. In the right panel we show the average matter profiles ΔΣ(R) for different richness bins in a given redshift bin. The color bands encode the 68% credible region for each profile. The profiles show variation with redshift and richness that is consistent with that shown in Fig. 3 for the simulated clusters in redshift and mass.
Current usage metrics show cumulative count of Article Views (full-text article views including HTML views, PDF and ePub downloads, according to the available data) and Abstracts Views on Vision4Press platform.
Data correspond to usage on the plateform after 2015. The current usage metrics is available 48-96 hours after online publication and is updated daily on week days.
Initial download of the metrics may take a while.