Fig. 4.
Download original image
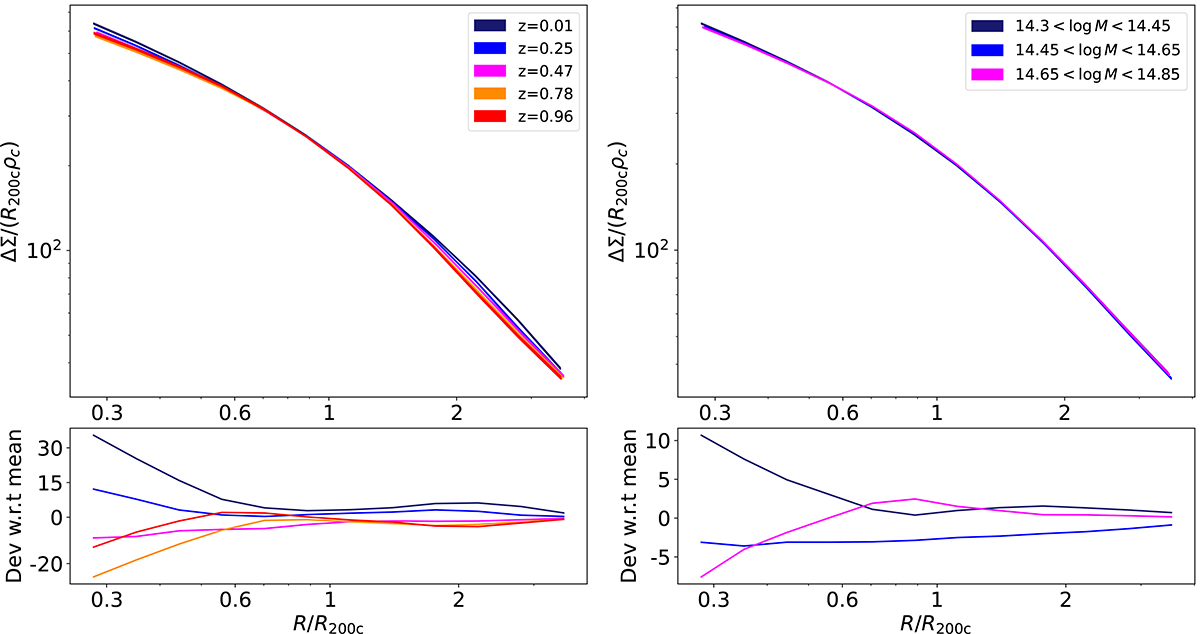
Average cluster matter profiles in the Magneticum simulation rescaled as in Eq. (12) to ![]() . In the left plot, we average all the clusters (14.3 < log(M200c/M⊙)< 15) for a given redshift and analyze the redshift trend. In the right plot, we average clusters over all redshift ranges (0.01 ≤ z ≤ 0.96) within a mass bin and analyze the mass trends. In both panels, the bottom plot shows the deviation of average profiles with respect to the mean of all the profiles. The rescaling dramatically reduces systematic trends in mass and redshift, highlighting the degree of self-similarity in the matter profiles even when baryonic components are included. The thickness of the lines in the upper panels represents the 68% credible region in the average matter profiles.
. In the left plot, we average all the clusters (14.3 < log(M200c/M⊙)< 15) for a given redshift and analyze the redshift trend. In the right plot, we average clusters over all redshift ranges (0.01 ≤ z ≤ 0.96) within a mass bin and analyze the mass trends. In both panels, the bottom plot shows the deviation of average profiles with respect to the mean of all the profiles. The rescaling dramatically reduces systematic trends in mass and redshift, highlighting the degree of self-similarity in the matter profiles even when baryonic components are included. The thickness of the lines in the upper panels represents the 68% credible region in the average matter profiles.
Current usage metrics show cumulative count of Article Views (full-text article views including HTML views, PDF and ePub downloads, according to the available data) and Abstracts Views on Vision4Press platform.
Data correspond to usage on the plateform after 2015. The current usage metrics is available 48-96 hours after online publication and is updated daily on week days.
Initial download of the metrics may take a while.