Open Access
Fig. 2.
Download original image
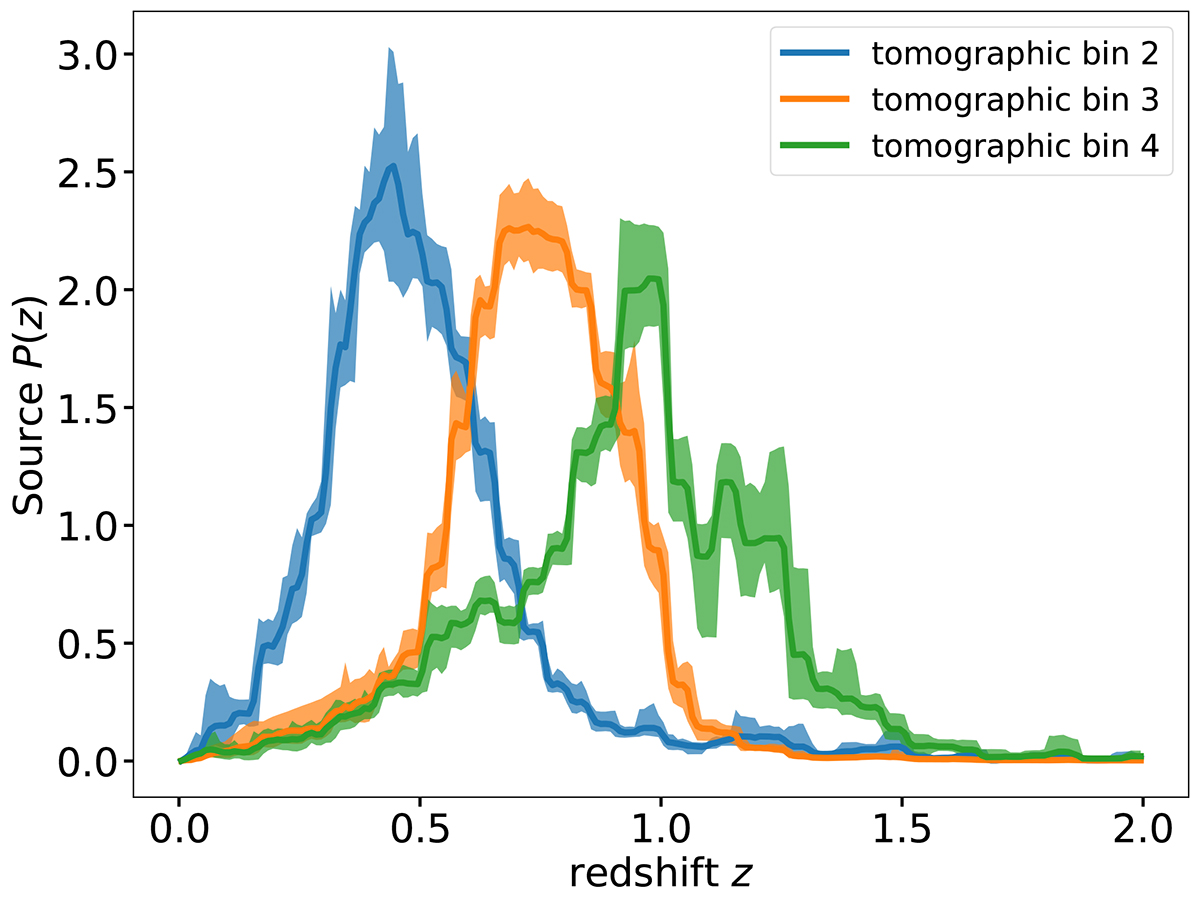
Dark Energy Survey Y3 lensing source redshift distribution for tomographic bins 2 through 4 that are used in this analysis. The solid line represents the mean and the shaded region depicts the 2σ uncertainties on the redshift distributions.
Current usage metrics show cumulative count of Article Views (full-text article views including HTML views, PDF and ePub downloads, according to the available data) and Abstracts Views on Vision4Press platform.
Data correspond to usage on the plateform after 2015. The current usage metrics is available 48-96 hours after online publication and is updated daily on week days.
Initial download of the metrics may take a while.