Fig. B.1.
Download original image
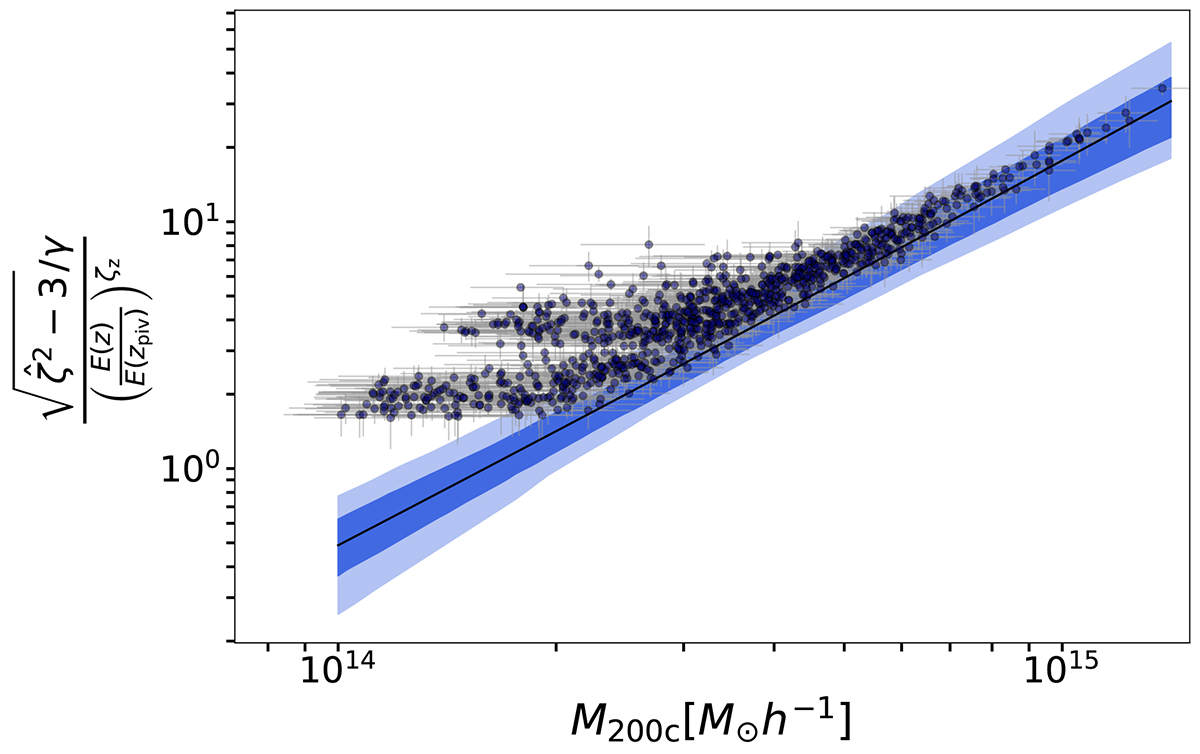
The observed debiased detection significance, ![]() , as a function of cluster halo mass for a mock SPT catalog (black dots). The solid black line indicates the intrinsic mean relation, and the shaded regions denote the 68% and 95% credible intervals. The similarities between the deviations of the mock clusters and of the real clusters (Fig. 13) about the mean relation are striking.
, as a function of cluster halo mass for a mock SPT catalog (black dots). The solid black line indicates the intrinsic mean relation, and the shaded regions denote the 68% and 95% credible intervals. The similarities between the deviations of the mock clusters and of the real clusters (Fig. 13) about the mean relation are striking.
Current usage metrics show cumulative count of Article Views (full-text article views including HTML views, PDF and ePub downloads, according to the available data) and Abstracts Views on Vision4Press platform.
Data correspond to usage on the plateform after 2015. The current usage metrics is available 48-96 hours after online publication and is updated daily on week days.
Initial download of the metrics may take a while.