Fig. 16.
Download original image
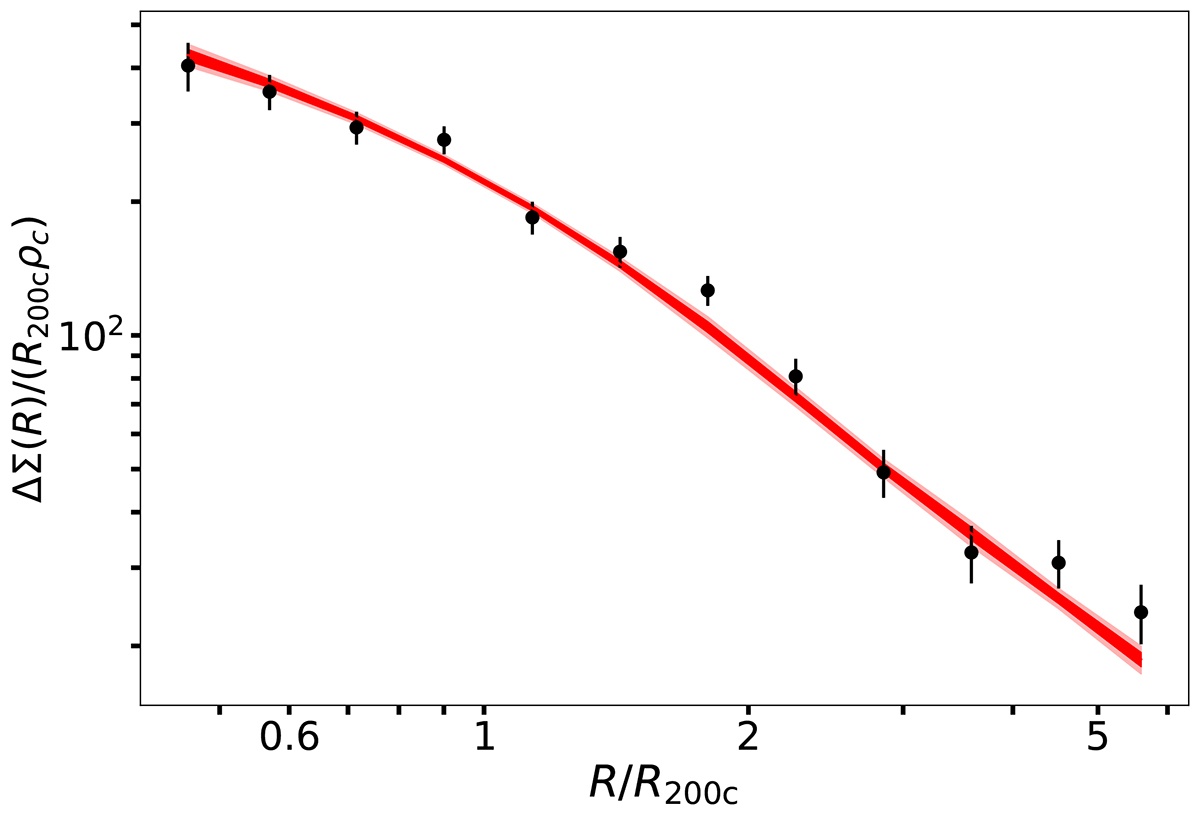
Average rescaled matter profile ![]() of the full sample of 698 clusters over the full mass and redshift ranges estimated using the mean mass posterior
of the full sample of 698 clusters over the full mass and redshift ranges estimated using the mean mass posterior ![]() for each cluster (see Eq. (49)). The black points represent the measured mean profile, and the error bars include not only shape noise but also marginalization over the cluster mass uncertainties. The dark and light-shaded red bands show 68% and 95% credible intervals, respectively, on the model profile extracted from hydrodynamical simulations.
for each cluster (see Eq. (49)). The black points represent the measured mean profile, and the error bars include not only shape noise but also marginalization over the cluster mass uncertainties. The dark and light-shaded red bands show 68% and 95% credible intervals, respectively, on the model profile extracted from hydrodynamical simulations.
Current usage metrics show cumulative count of Article Views (full-text article views including HTML views, PDF and ePub downloads, according to the available data) and Abstracts Views on Vision4Press platform.
Data correspond to usage on the plateform after 2015. The current usage metrics is available 48-96 hours after online publication and is updated daily on week days.
Initial download of the metrics may take a while.