Fig. 14.
Download original image
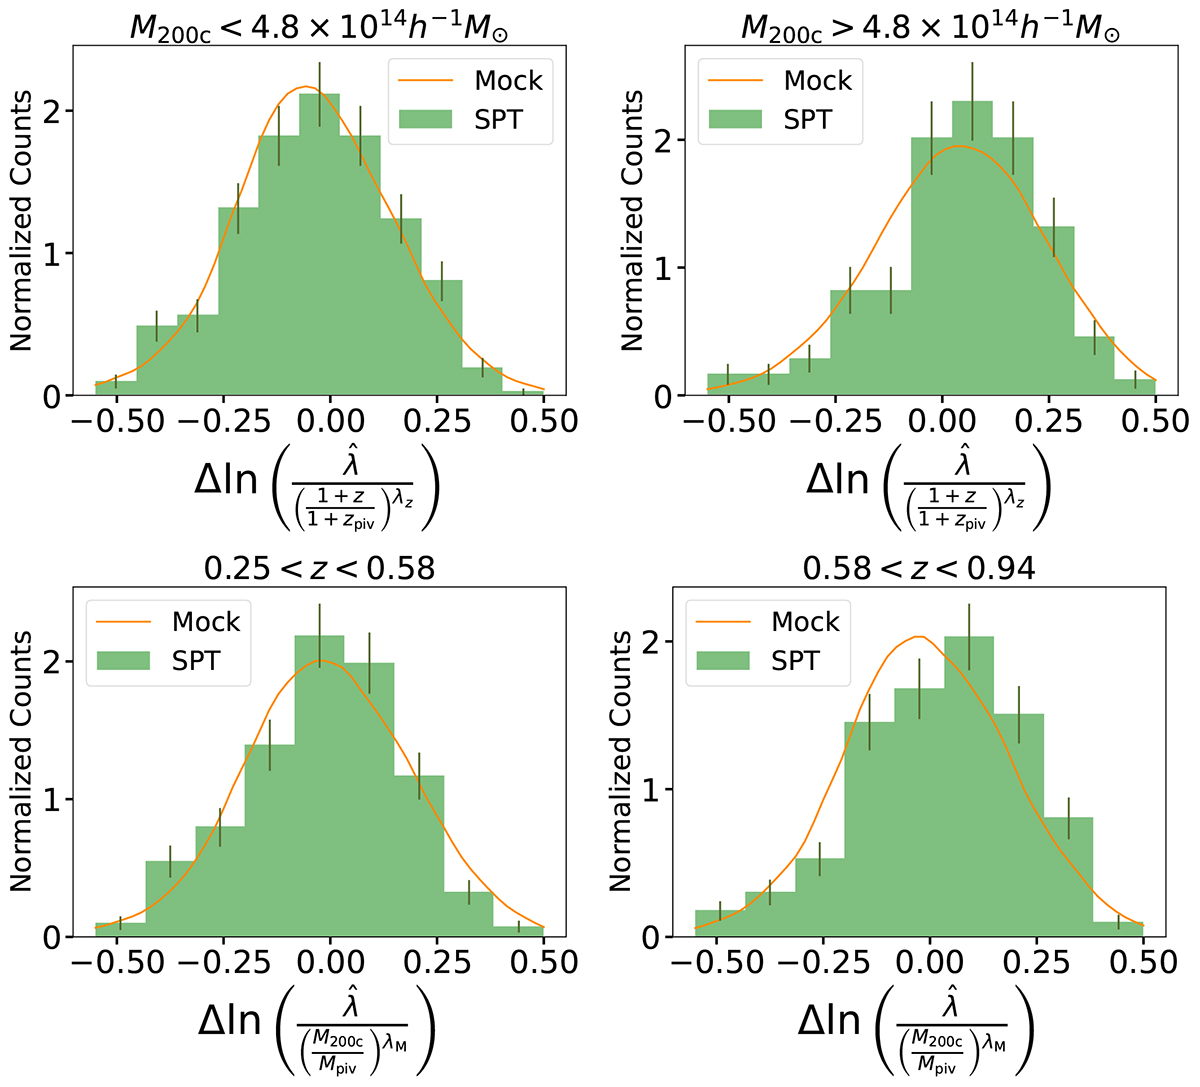
Distributions of deviations in ![]() about the intrinsic observable-mass relation shown for the SPT sample (green histogram) and a mock dataset (100 times larger) drawn from that same intrinsic relation (orange line). The top (bottom) panels show the deviations in low and high mass (redshift) with the measured redshift (mass) trend removed as in Fig. 12.
about the intrinsic observable-mass relation shown for the SPT sample (green histogram) and a mock dataset (100 times larger) drawn from that same intrinsic relation (orange line). The top (bottom) panels show the deviations in low and high mass (redshift) with the measured redshift (mass) trend removed as in Fig. 12.
Current usage metrics show cumulative count of Article Views (full-text article views including HTML views, PDF and ePub downloads, according to the available data) and Abstracts Views on Vision4Press platform.
Data correspond to usage on the plateform after 2015. The current usage metrics is available 48-96 hours after online publication and is updated daily on week days.
Initial download of the metrics may take a while.