Fig. 12.
Download original image
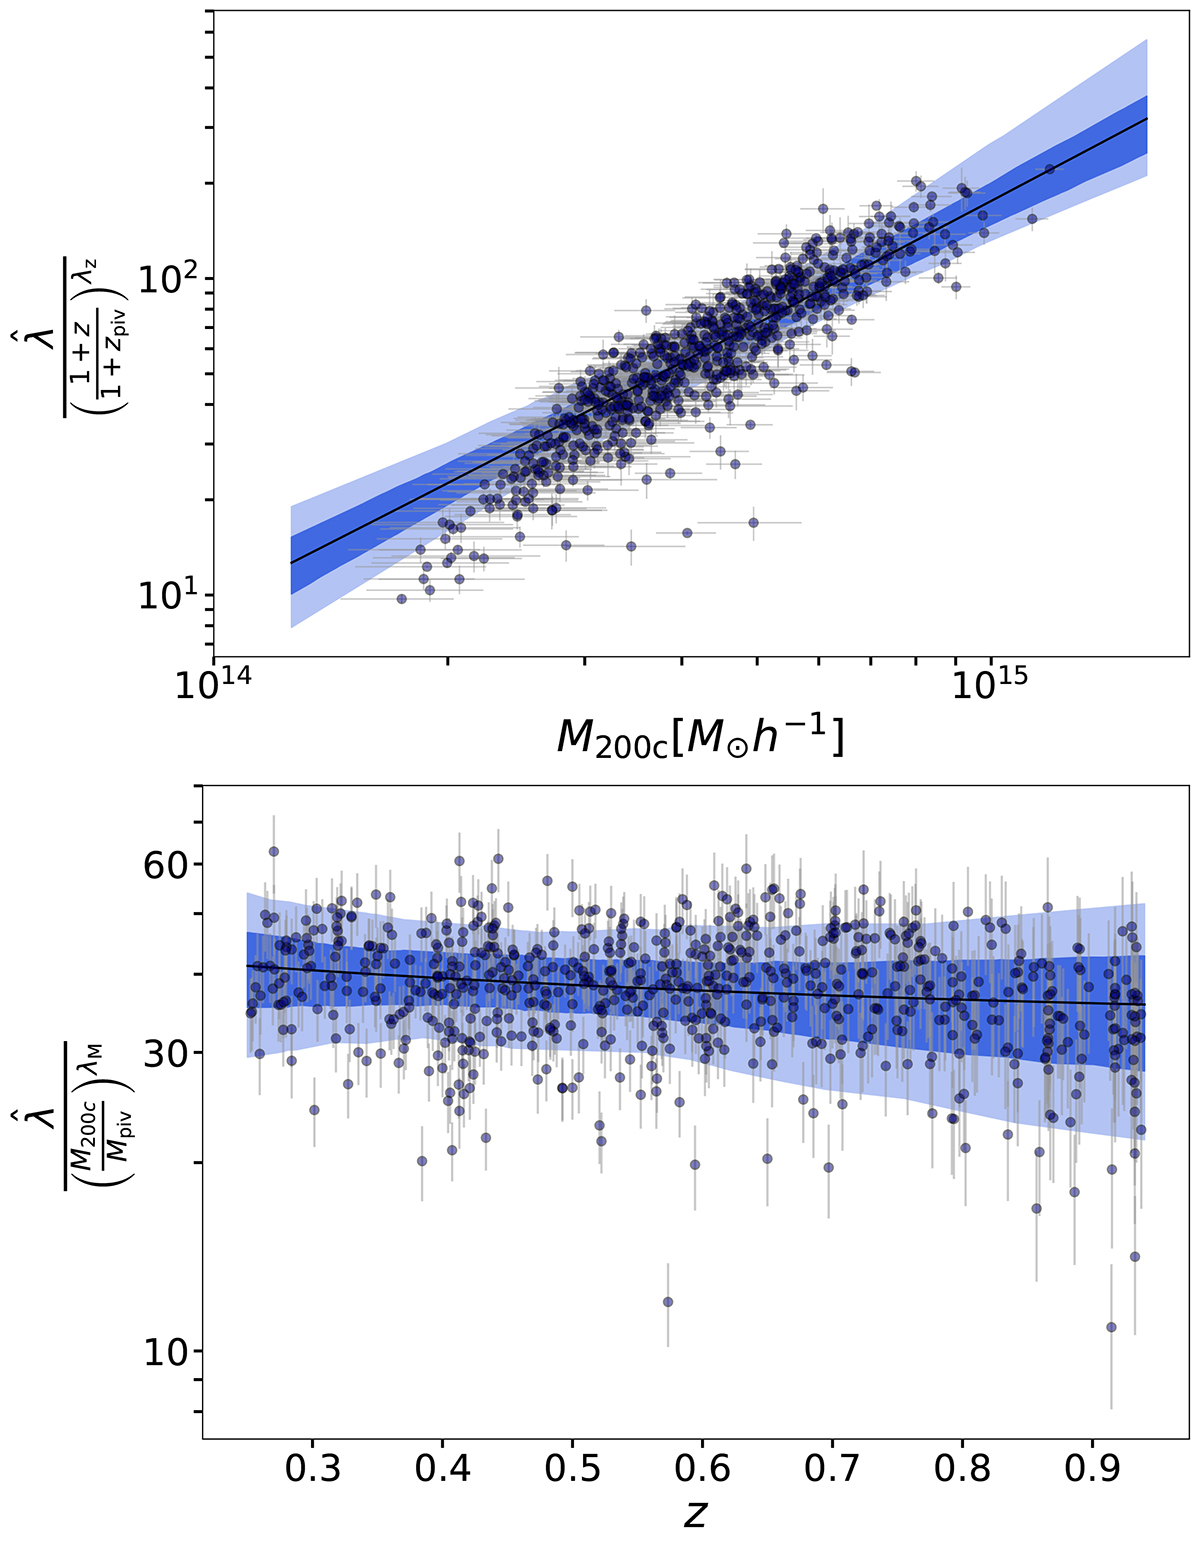
Observed optical richness ![]() of SPT clusters as a function of the cluster halo mass (top) and redshift (bottom). The clusters are shown with filled circles, where the error bars also capture the error in the observable-mass relations and the estimated cluster halo mass. The top and bottom plots shows the richness
of SPT clusters as a function of the cluster halo mass (top) and redshift (bottom). The clusters are shown with filled circles, where the error bars also capture the error in the observable-mass relations and the estimated cluster halo mass. The top and bottom plots shows the richness ![]() normalized at the pivot redshift zpiv = 0.6 and the pivot mass Mpiv = 3 × 10¹⁴h−1 Mpc, respectively. The intrinsic model (Eq. (27)) is shown in blue. The light and dark-shaded regions in both the panels represent 68% and 95% credible intervals of the mean model respectively.
normalized at the pivot redshift zpiv = 0.6 and the pivot mass Mpiv = 3 × 10¹⁴h−1 Mpc, respectively. The intrinsic model (Eq. (27)) is shown in blue. The light and dark-shaded regions in both the panels represent 68% and 95% credible intervals of the mean model respectively.
Current usage metrics show cumulative count of Article Views (full-text article views including HTML views, PDF and ePub downloads, according to the available data) and Abstracts Views on Vision4Press platform.
Data correspond to usage on the plateform after 2015. The current usage metrics is available 48-96 hours after online publication and is updated daily on week days.
Initial download of the metrics may take a while.