Open Access
Fig. 11.
Download original image
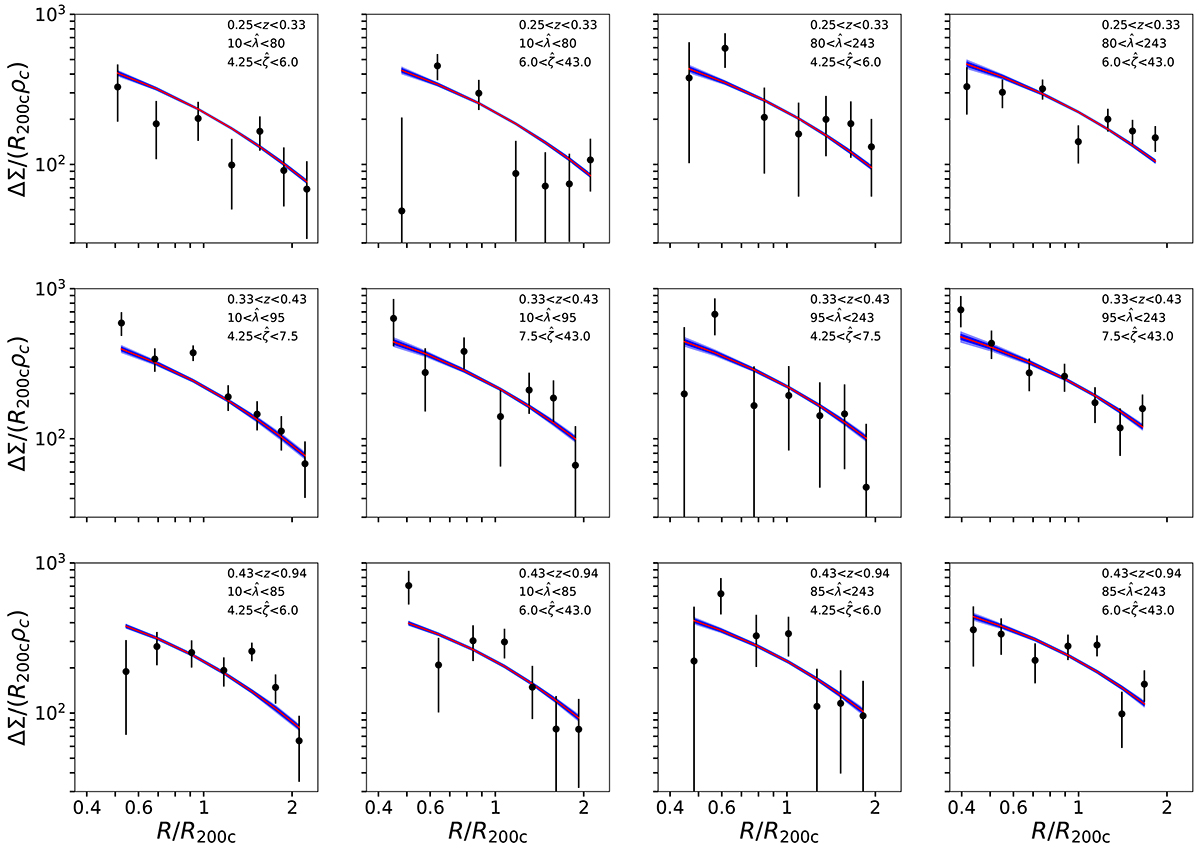
Average SPT cluster matter profiles corresponding to the mean recovered parameters in twelve ![]() bins are shown with black data points with 1σ error bars. The WL model is shown in the red line and the shaded blue region represents 2σ error region on the model.
bins are shown with black data points with 1σ error bars. The WL model is shown in the red line and the shaded blue region represents 2σ error region on the model.
Current usage metrics show cumulative count of Article Views (full-text article views including HTML views, PDF and ePub downloads, according to the available data) and Abstracts Views on Vision4Press platform.
Data correspond to usage on the plateform after 2015. The current usage metrics is available 48-96 hours after online publication and is updated daily on week days.
Initial download of the metrics may take a while.