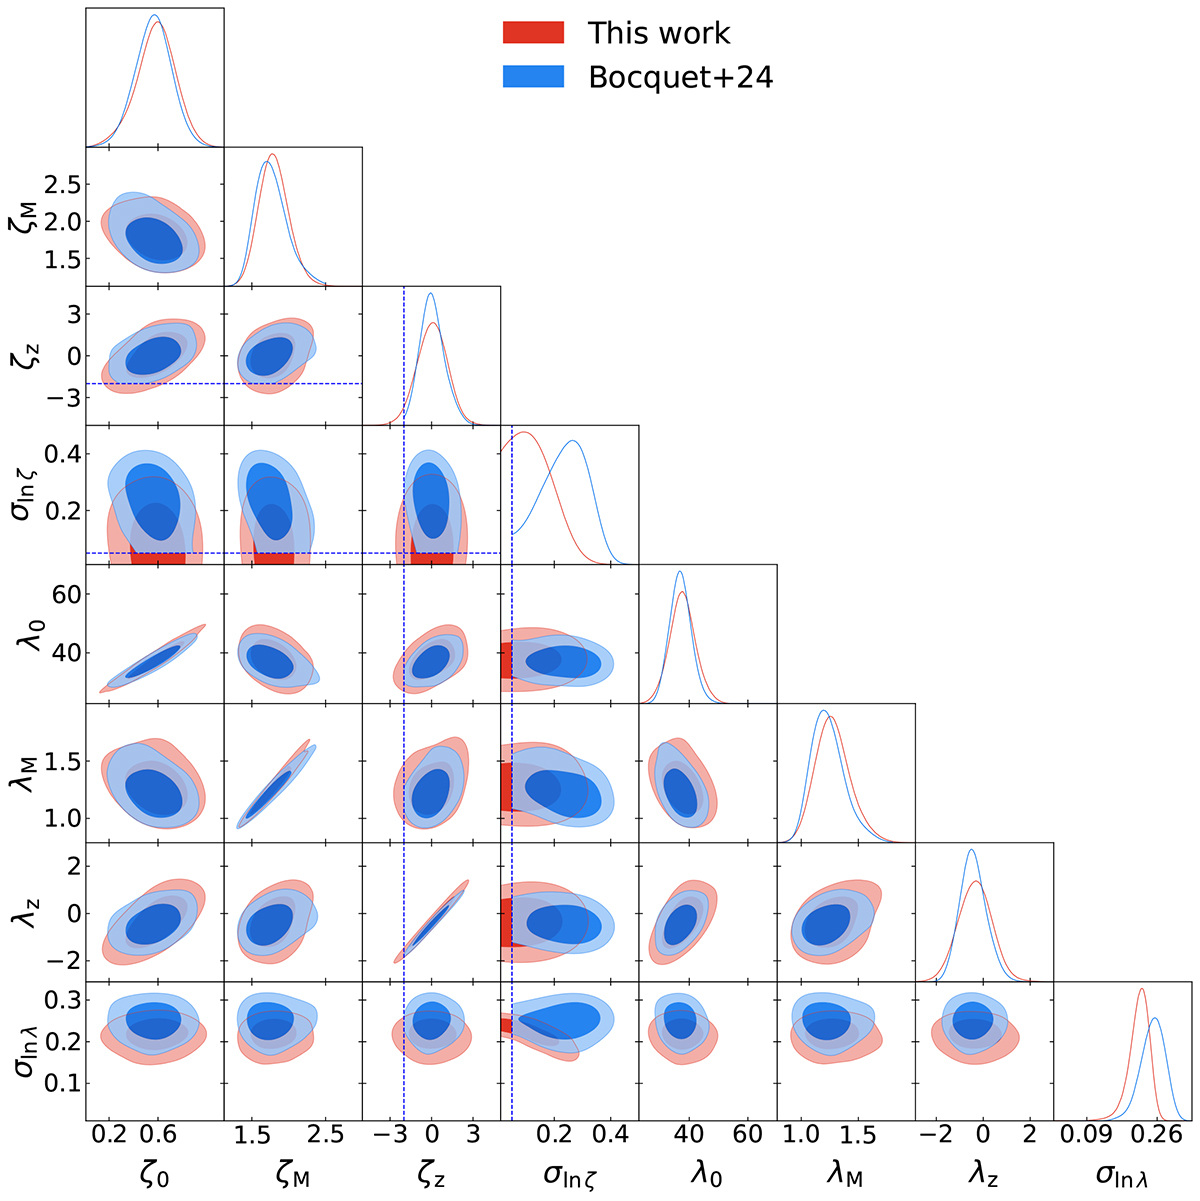
Fig. 10.
Download original image
Contour plot showing the posterior constraints for cluster mass calibration using average matter profiles (in red) of the SPT cluster sample in a ΛCDM model. The blue contour shows cluster-by-cluster WL-only mass calibration results from Bocquet et al. (2024a) for the same SPT sample. The dashed blue line shows the prior boundary used in Bocquet et al. (2024a) for two parameters which is smaller than ours.
Current usage metrics show cumulative count of Article Views (full-text article views including HTML views, PDF and ePub downloads, according to the available data) and Abstracts Views on Vision4Press platform.
Data correspond to usage on the plateform after 2015. The current usage metrics is available 48-96 hours after online publication and is updated daily on week days.
Initial download of the metrics may take a while.