Fig. 1.
Download original image
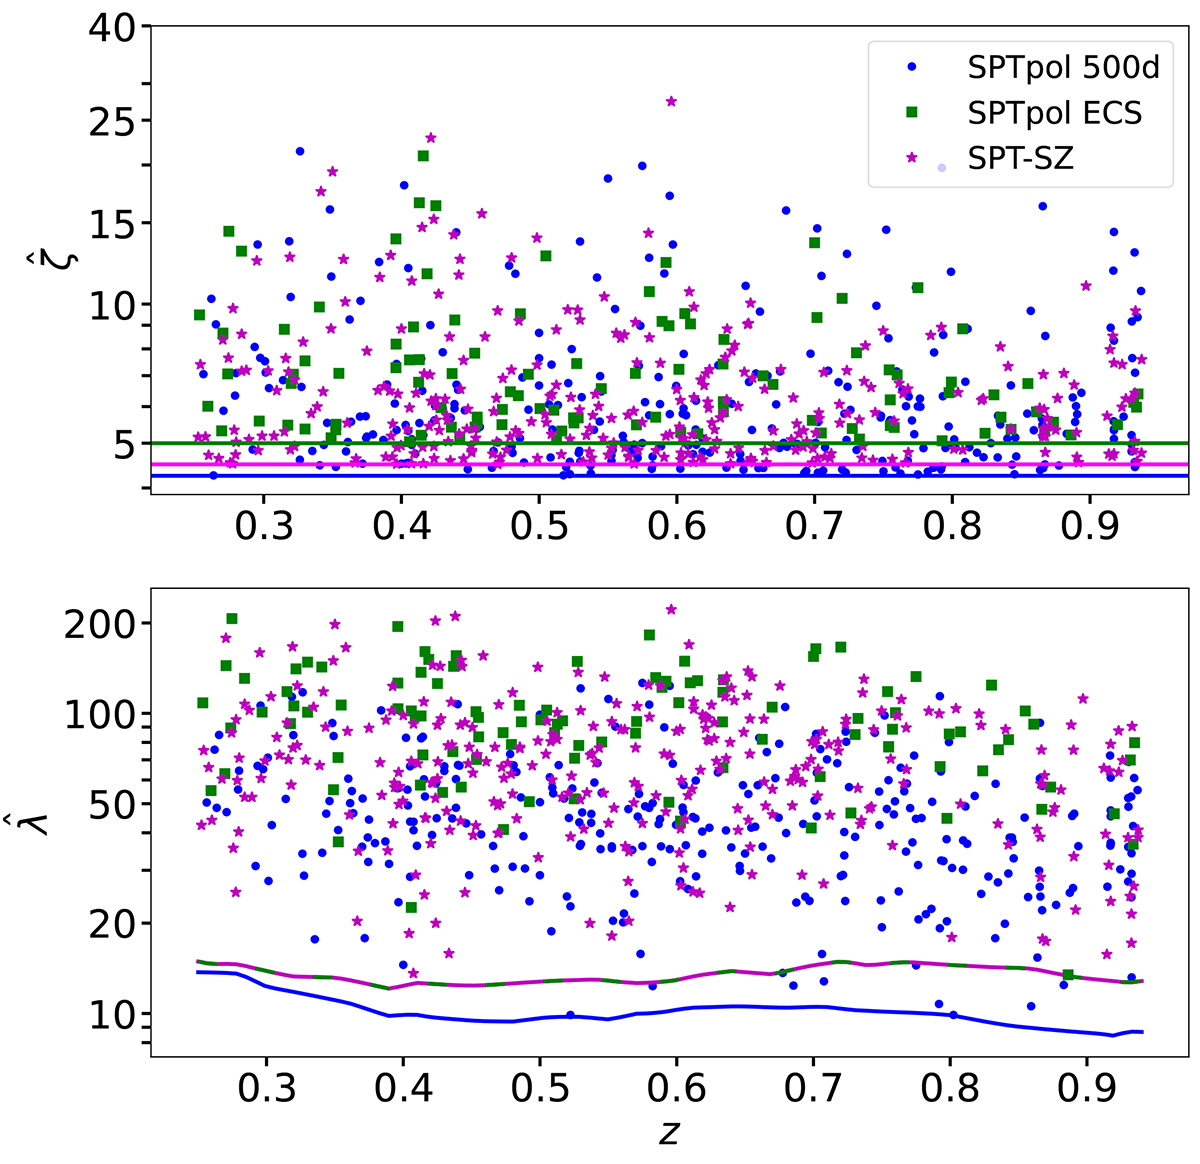
Distribution of observed tSZE detection significance ![]() and richness
and richness ![]() as a function of redshift for the 698 galaxy clusters in the SPT sample that overlap the DES region. The solid line in the top figure shows the detection threshold for the three survey regions. In the bottom figure, the colored lines correspond to the
as a function of redshift for the 698 galaxy clusters in the SPT sample that overlap the DES region. The solid line in the top figure shows the detection threshold for the three survey regions. In the bottom figure, the colored lines correspond to the ![]() detection threshold for each survey.
detection threshold for each survey.
Current usage metrics show cumulative count of Article Views (full-text article views including HTML views, PDF and ePub downloads, according to the available data) and Abstracts Views on Vision4Press platform.
Data correspond to usage on the plateform after 2015. The current usage metrics is available 48-96 hours after online publication and is updated daily on week days.
Initial download of the metrics may take a while.