Fig. 21.
Download original image
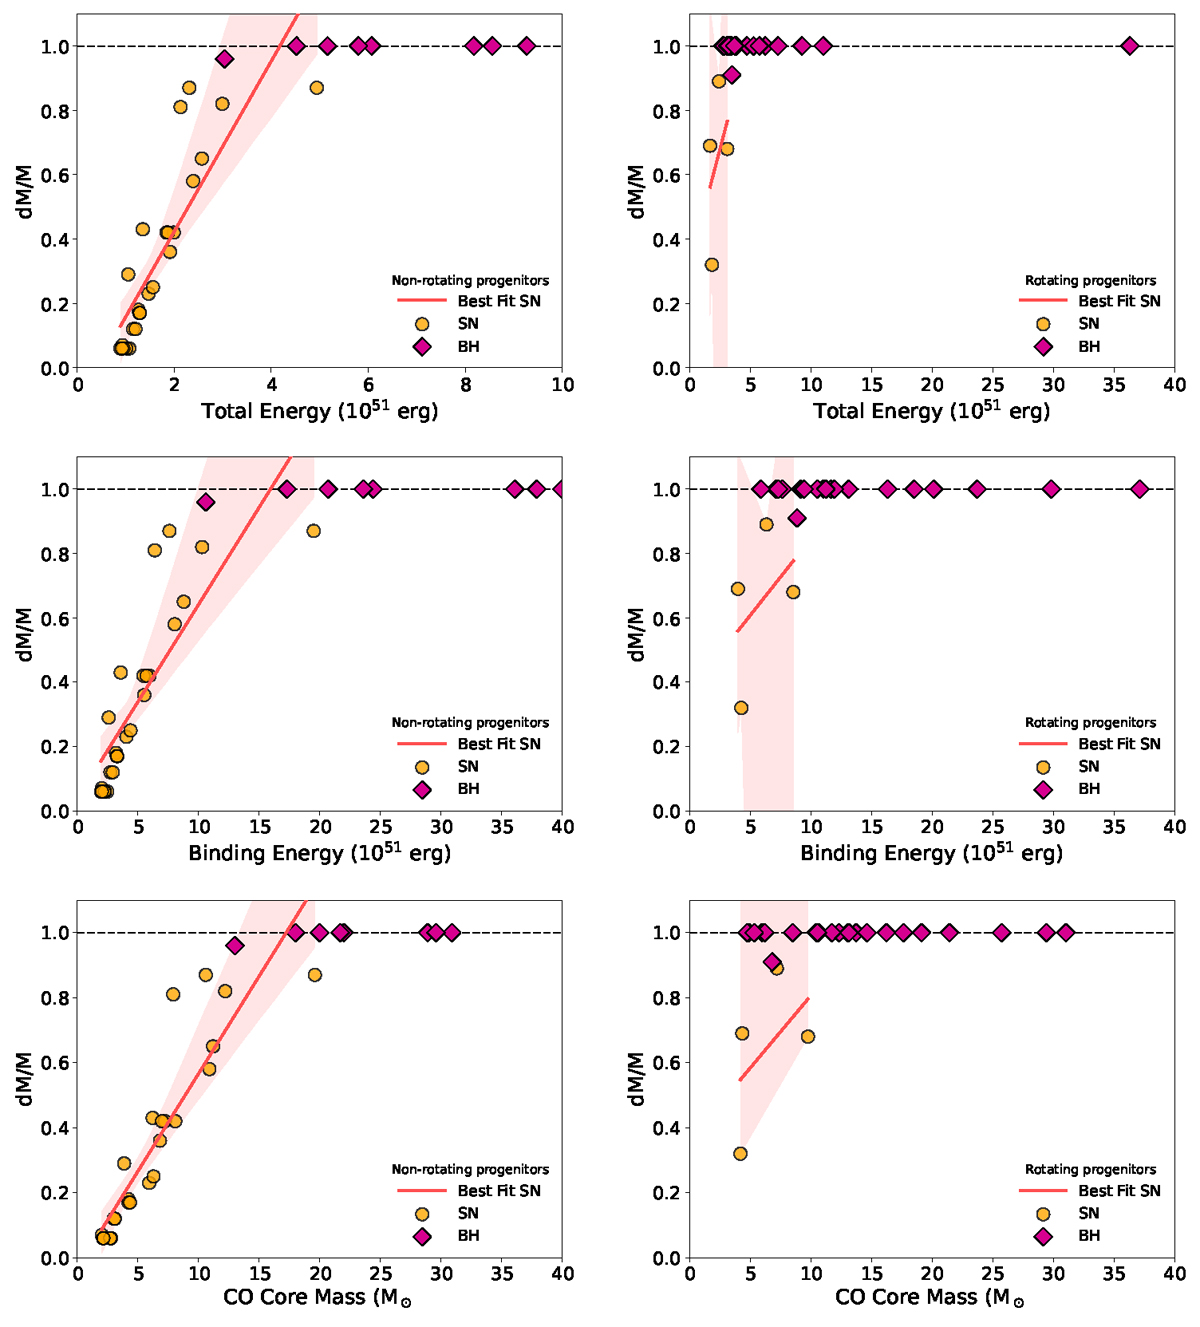
Linear relation between the mass that falls back after the explosions and some structural properties of the stellar progenitors at the pre-SN stage, such as the absolute value of the total energy (top panels), the binding energy (central panels), and the CO core mass (bottom panels). We have performed such analysis both for the non-rotating (left panels) and for the rotating stellar progenitors (right panels). We studied the fate of the explosion independently of the initial metallicity. Thus, in each panel we have all the models with [Fe/H] = 0 −1, −2, −3. In each panel the circular orange points are the stellar progenitors undergoing successful SN explosions and the best fit for dM/M is the solid red line, while the diamond purple points represents the progenitors which DC to BHs. The black dashed line corresponds to dM/M = 1 i.e., the value of dM/M for the DC. The red shaded area is the 95% confidence interval for the SN linear regression.
Current usage metrics show cumulative count of Article Views (full-text article views including HTML views, PDF and ePub downloads, according to the available data) and Abstracts Views on Vision4Press platform.
Data correspond to usage on the plateform after 2015. The current usage metrics is available 48-96 hours after online publication and is updated daily on week days.
Initial download of the metrics may take a while.