Fig. 17.
Download original image
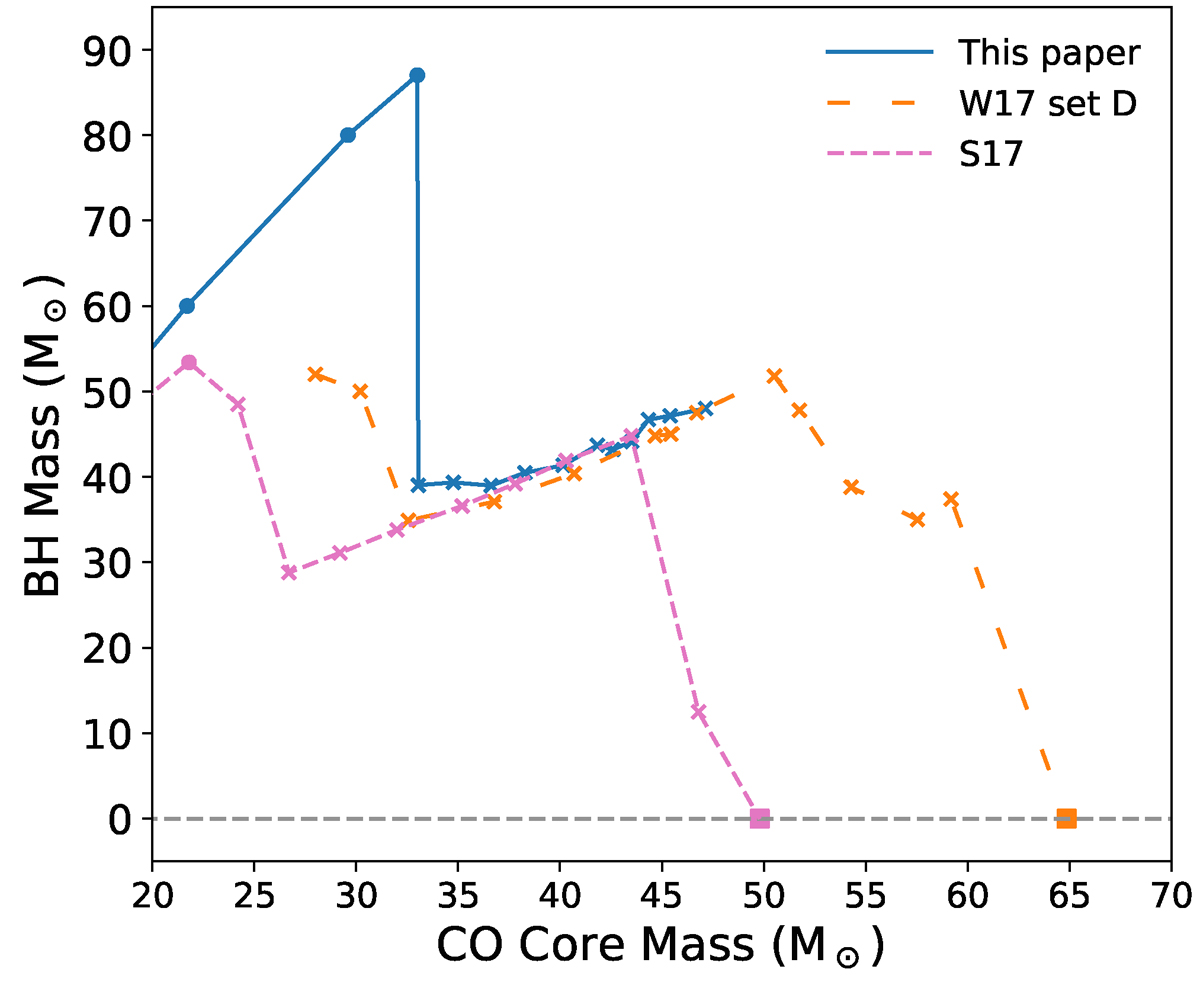
Black hole mass spectrum as a function of the CO core mass from various authors. Solid blue line: this work, non-rotating progenitors at [Fe/H] =−3; long dashed orange line: set D of W17 (we note that these models are obtained from stellar tracks computed at Z = 0.1 Z⊙ for which the mass loss has been inhibited, making these models distinct from those we used to compute the final remnant masses.); dashed pink line: models from Spera & Mapelli (2017) with Z = 1.3 × 10⁻² Z⊙ (S17). Circles (crosses) represent the models that are stable (unstable) against pair production, and squares are the stars disrupted by PISNe.
Current usage metrics show cumulative count of Article Views (full-text article views including HTML views, PDF and ePub downloads, according to the available data) and Abstracts Views on Vision4Press platform.
Data correspond to usage on the plateform after 2015. The current usage metrics is available 48-96 hours after online publication and is updated daily on week days.
Initial download of the metrics may take a while.