Fig. 13.
Download original image
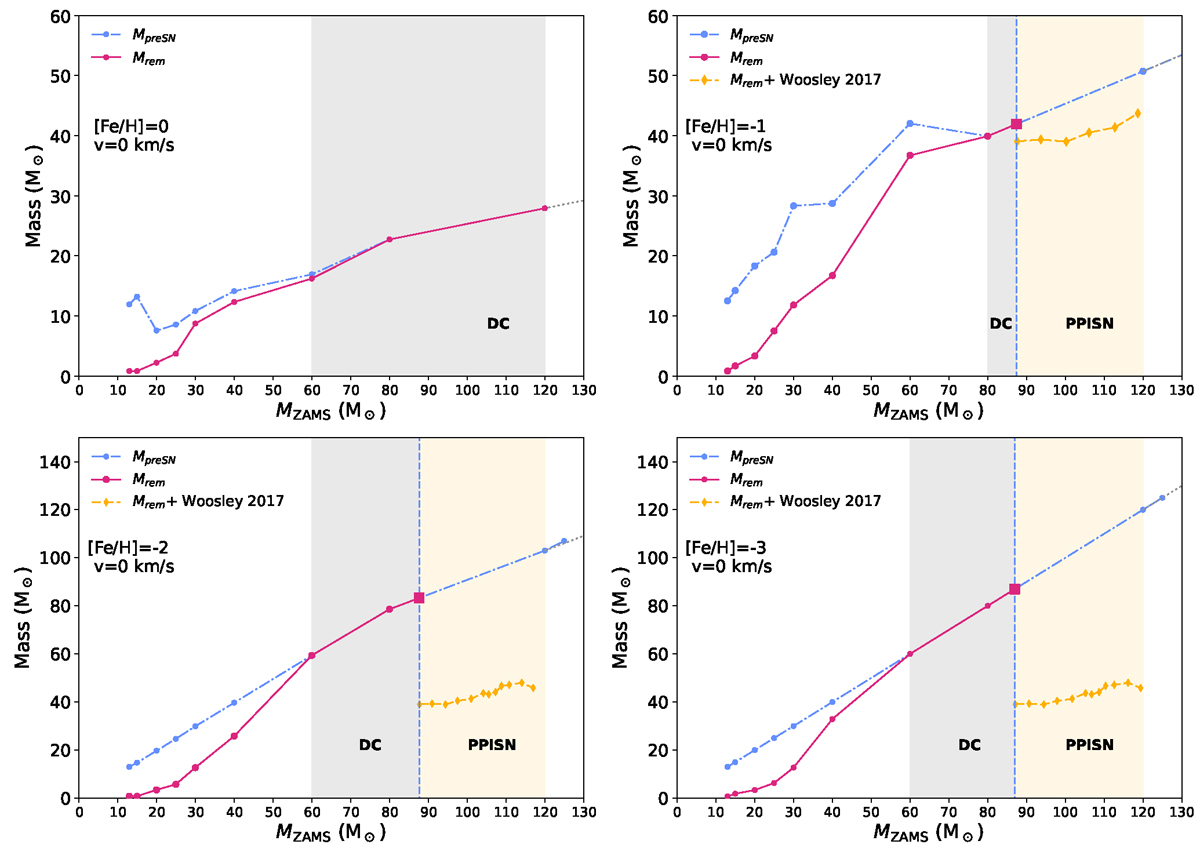
Pre-SN mass (dash-dotted light blue line), pre-SN mass extrapolated for MZAMS > 120M⊙ (dotted gray line), remnant mass (solid violet line), and the remnant mass for the stars that develop pair instabilities (dashed yellow line), as a function of MZAMS. The red points represent the stellar progenitors of the FRANEC grid, while the larger red squares correspond to the last progenitor stable against pair production, which has been obtained through interpolation (see Sect. 2.3 and Table C.1). The shaded gray area represents the region of DC, the shaded yellow area shows where stars undergo PPISNe. The vertical dashed lines represent the threshold values above which stars enter the PI regions.
Current usage metrics show cumulative count of Article Views (full-text article views including HTML views, PDF and ePub downloads, according to the available data) and Abstracts Views on Vision4Press platform.
Data correspond to usage on the plateform after 2015. The current usage metrics is available 48-96 hours after online publication and is updated daily on week days.
Initial download of the metrics may take a while.