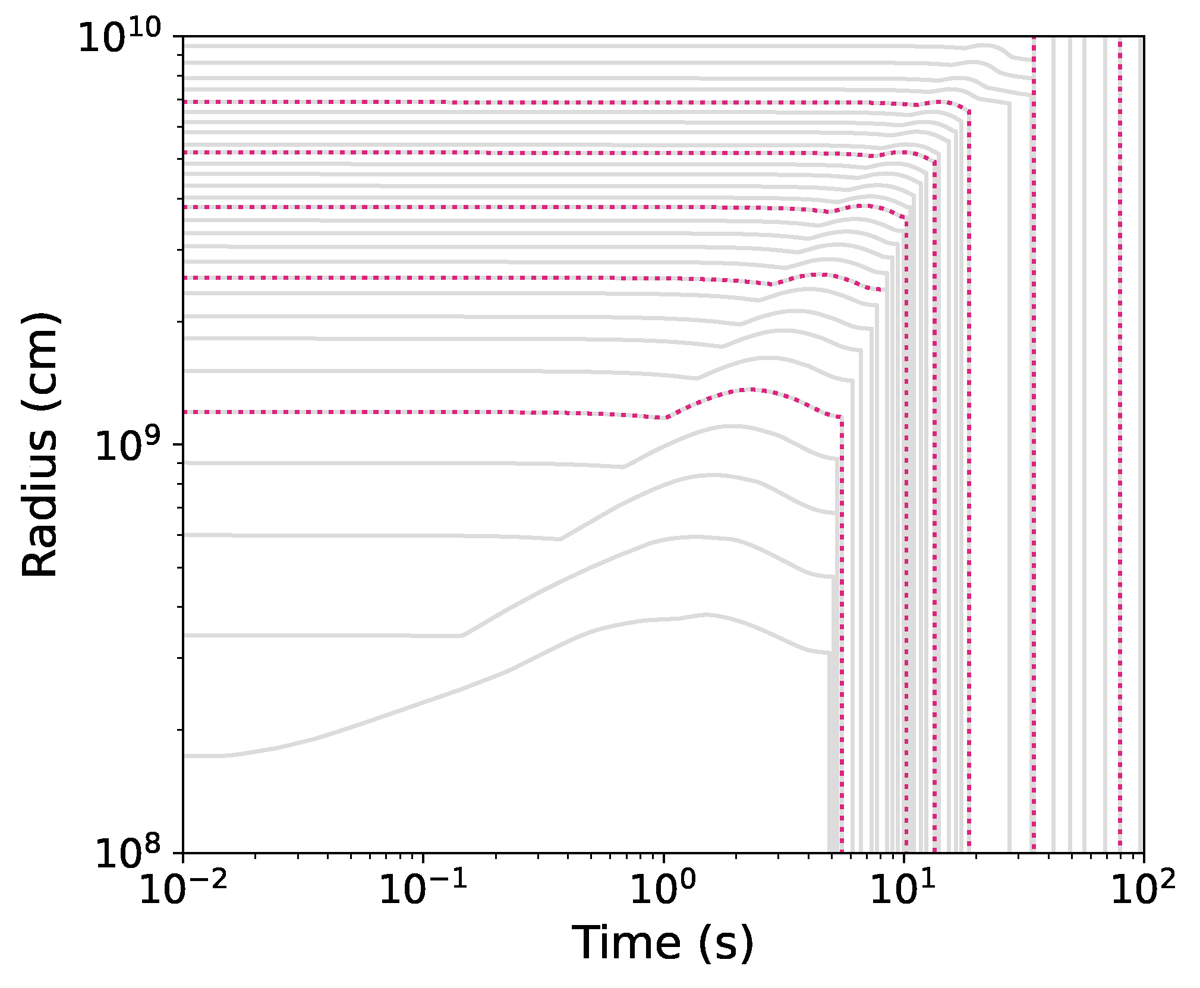
Fig. 11.
Download original image
Same as Figure 7 but for the most central region of the progenitor with MZAMS = 80 M⊙ and [Fe/H] = −2, where we can better appreciate the fallback of the layers right after being accelerated by the shock wave. We show the behavior of the shell enclosing different values of mass, of 1 M⊙ (each solid light gray lines) and 5 M⊙ (each dotted purple line), respectively.
Current usage metrics show cumulative count of Article Views (full-text article views including HTML views, PDF and ePub downloads, according to the available data) and Abstracts Views on Vision4Press platform.
Data correspond to usage on the plateform after 2015. The current usage metrics is available 48-96 hours after online publication and is updated daily on week days.
Initial download of the metrics may take a while.