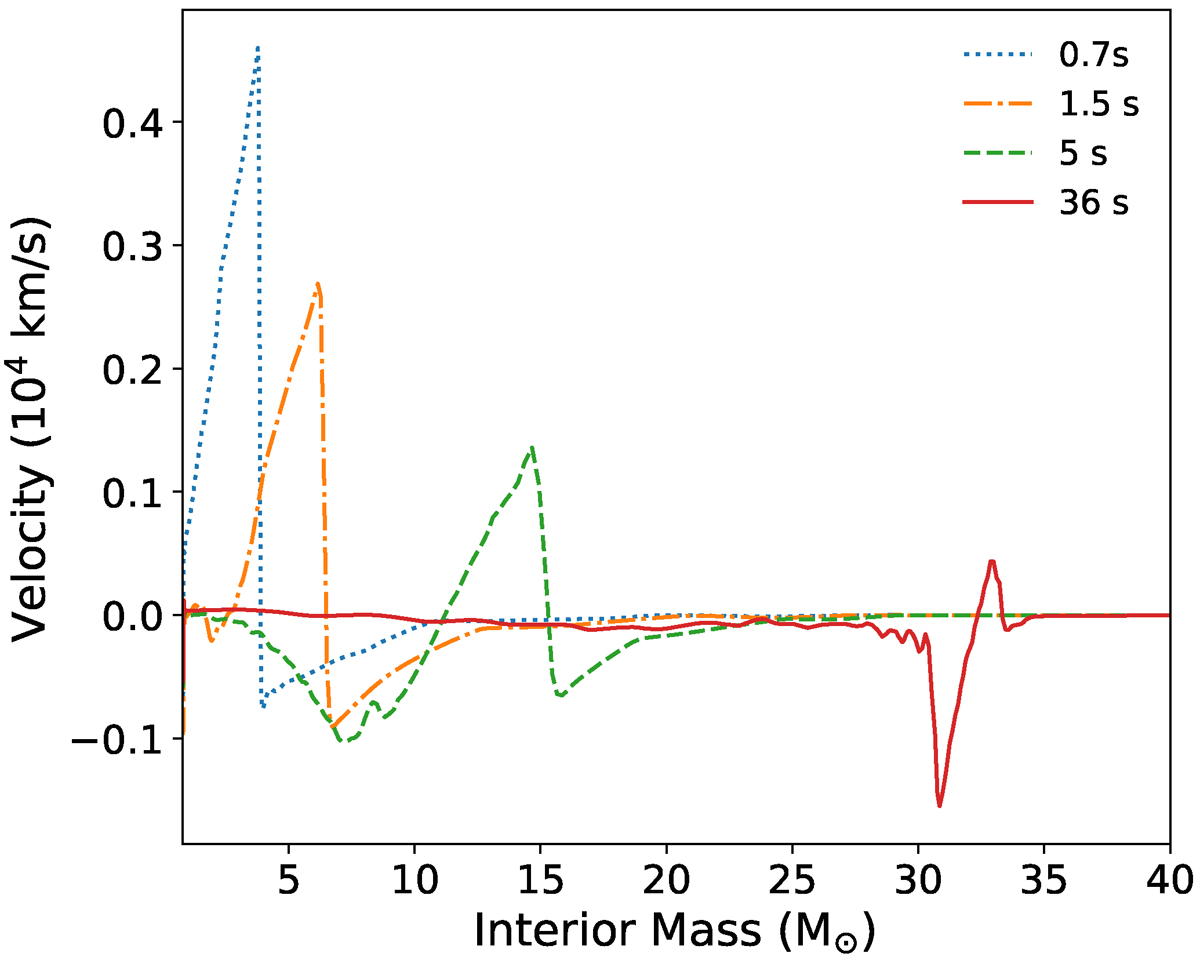
Fig. 10.
Download original image
Same as Figure 5 but for a directly collapsing progenitor. The velocity profile is reported at different crucial times during the explosion: when the explosive nucleosynthesis stops (dotted blue line), when the layers behind the shock start to fallback onto the compact remnant (dash-dotted orange line), when the shock enters the CO core (dashed green line) and when the velocity of the shock becomes negligible (solid red line).
Current usage metrics show cumulative count of Article Views (full-text article views including HTML views, PDF and ePub downloads, according to the available data) and Abstracts Views on Vision4Press platform.
Data correspond to usage on the plateform after 2015. The current usage metrics is available 48-96 hours after online publication and is updated daily on week days.
Initial download of the metrics may take a while.