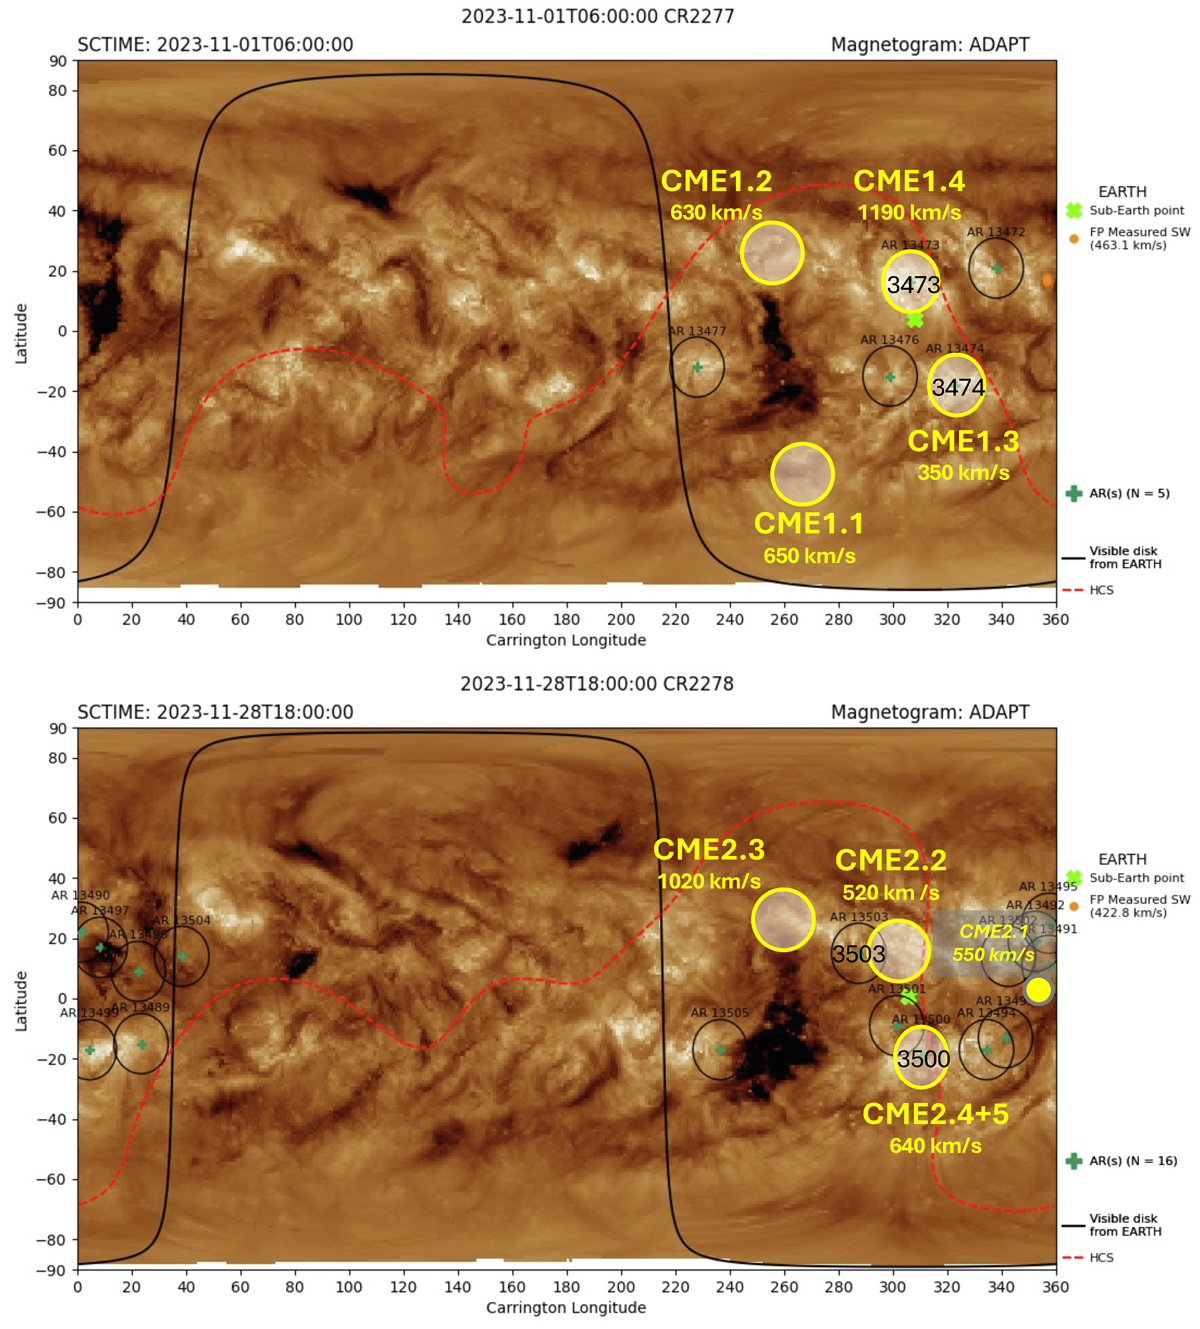
Fig. 6.
Download original image
Location of the HCS and respective CME source regions (yellow circles) overlaid on SDO/AIA 193 Å synoptic images. The HCS location is derived by the Magnetic Connectivity Tool on the basis of a PFSS (Riley et al. 2006) extrapolation for a surface height of 3Rs. The results are provided by IRAP at http://connect-tool.irap.omp.eu (see Rouillard et al. 2020).
Current usage metrics show cumulative count of Article Views (full-text article views including HTML views, PDF and ePub downloads, according to the available data) and Abstracts Views on Vision4Press platform.
Data correspond to usage on the plateform after 2015. The current usage metrics is available 48-96 hours after online publication and is updated daily on week days.
Initial download of the metrics may take a while.