Fig. 5.
Download original image
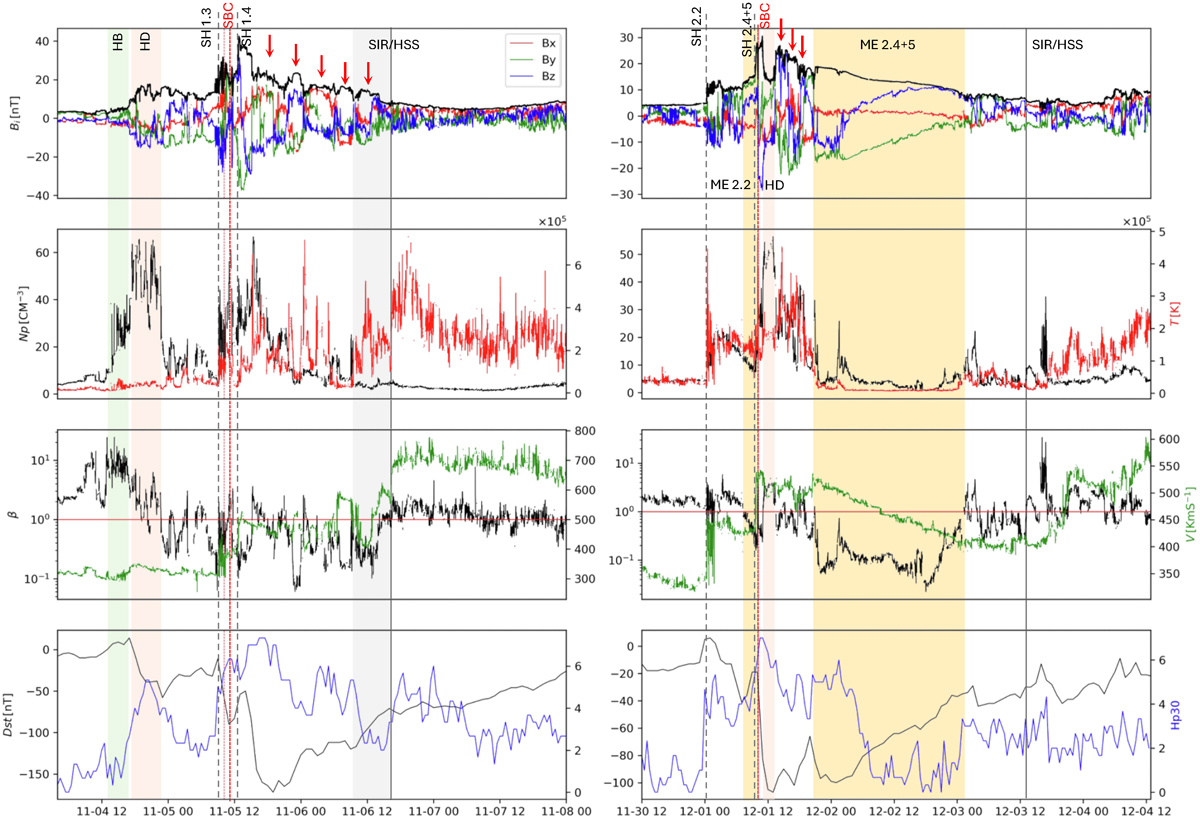
OMNI in situ measurements and geomagnetic indices for each rotation (x-axis shows time in UT). From top to bottom: magnetic field and vector components, density+temperature, plasma-β+speed, Dst+Hp30. Shown are a high plasma-β structure heliospheric plasma sheet (HB), high-density (HD) structures, the shocks (SH; dashed vertical lines) from various CMEs, the sector boundary crossing (SBC; dotted red vertical line), magnetic ejecta (ME) related to the different CMEs, and the start of the SIR/HSS (gray shaded area marks the interaction zone between the rear-part of the CME and the starting of the SIR). The red arrows indicate the observed ripples (short-term variations in the total magnetic field associated with strong fluctuations in the temperature and density profiles). A zoomed-in image for the regions around the SBC is shown in Fig. A.7.
Current usage metrics show cumulative count of Article Views (full-text article views including HTML views, PDF and ePub downloads, according to the available data) and Abstracts Views on Vision4Press platform.
Data correspond to usage on the plateform after 2015. The current usage metrics is available 48-96 hours after online publication and is updated daily on week days.
Initial download of the metrics may take a while.