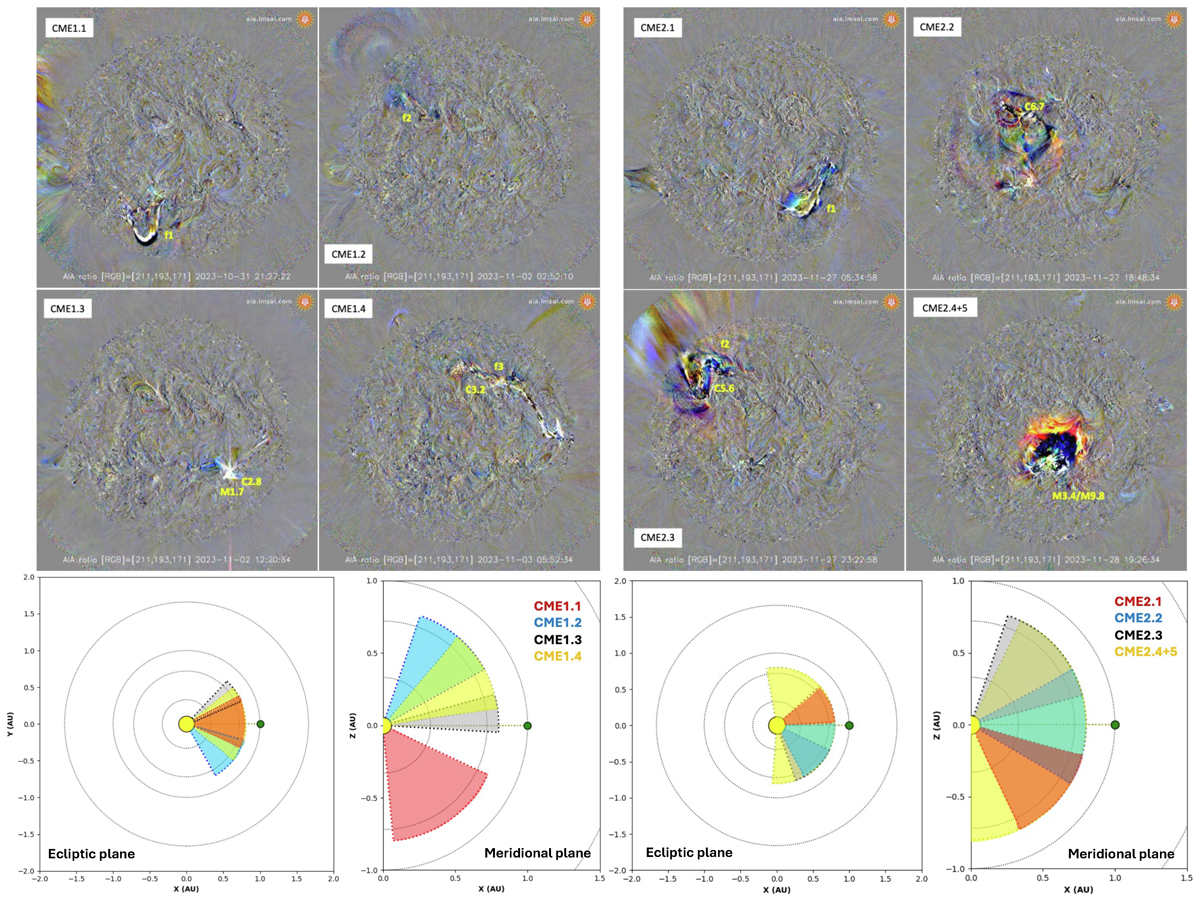
Fig. 2.
Download original image
Overview of the eruption sites and CME cone projections. Top panels: SDO/AIA EUV composite ratio images (source: suntoday.lmsal.com) for each eruptive event. Bottom panels: CME cone geometry derived from GCS results (longitude, latitude, tilt) projected on the ecliptic and meridional plane. The events are annotated with the eruption related GOES SXR flare classes. Left panels: Rotation #1 over the period from 2023-10-31 21:27 UT to 2023-11-03 05:52 UT. CME1.1+1.2+1.4 are related to filament eruptions f1+f2+f3, respectively. Right panels: rotation #2 over the period 2023-11-27 18:48 UT until 2023-11-28 19:50 UT. CME2.1+2.4 are related to filament eruptions f1+f2, respectively.
Current usage metrics show cumulative count of Article Views (full-text article views including HTML views, PDF and ePub downloads, according to the available data) and Abstracts Views on Vision4Press platform.
Data correspond to usage on the plateform after 2015. The current usage metrics is available 48-96 hours after online publication and is updated daily on week days.
Initial download of the metrics may take a while.