Fig. 1.
Download original image
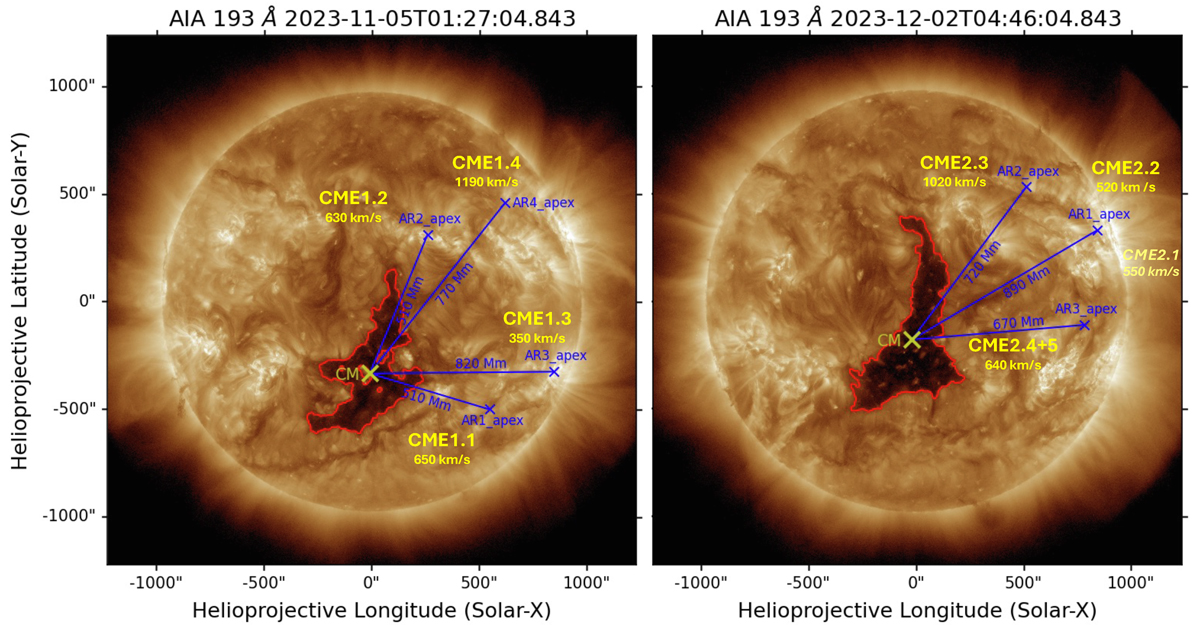
General overview of the CME occurrence and CHs for the two episodes, rotation #1 (left panel) and rotation #2 (right panel), overlaid on AIA 193 Å images. Given are the CH locations with their center of mass (CM) and apex distances to the active regions (AR) from which the CMEs were launched (see details in Sect. 2.1). For each CME the 3D speed information is given as derived from a linear fit to sequential GCS reconstructions. For rotation #1 we observe four CMEs (CME1.1–1.4) and for rotation #2 five CMEs (CME2.1–2.4+5). We note that for CME 2.1 the corresponding active region is already behind the western limb, and therefore no AR distance is given. The image dates were chosen such that the CH is centrally located for better visibility.
Current usage metrics show cumulative count of Article Views (full-text article views including HTML views, PDF and ePub downloads, according to the available data) and Abstracts Views on Vision4Press platform.
Data correspond to usage on the plateform after 2015. The current usage metrics is available 48-96 hours after online publication and is updated daily on week days.
Initial download of the metrics may take a while.