Fig. 8
Download original image
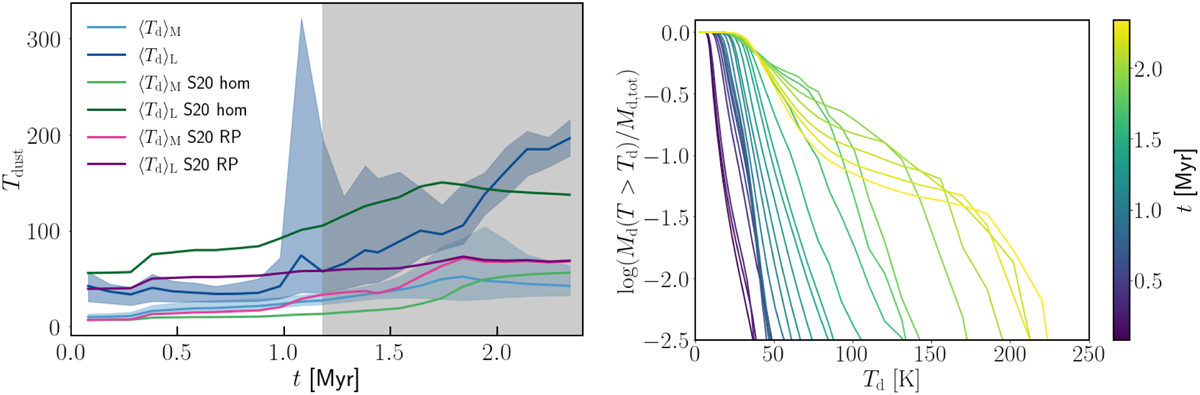
Evolution of the dust temperature during the cloud lifetime, after the onset of SF. Left panel. The solid light blue (dark blue) line shows the median of the mass-weighted (luminosity-weighted) distributions for the simulated MC. The shaded areas mark the 16th and 84th percentiles of each distribution. The light green (dark green) line shows the evolution of the mass-weighted (luminosity-weighted) distributions for the local cloud model by S20 in the uniform case. For the radiation pressure case, we show in light magenta (dark magenta) the mass-weighted (luminosity- weighted) distributions. The shaded gray area highlights the period when the cloud is dispersed according to the radiation–pressure model from S20 (cf. Sect. 2.3.) Right panel. Cumulative distribution of the fractional mass of dust (Md(T > Td)/Md,tot) that has a temperature larger than Td, color-coded according to the evolution time t of the MC.
Current usage metrics show cumulative count of Article Views (full-text article views including HTML views, PDF and ePub downloads, according to the available data) and Abstracts Views on Vision4Press platform.
Data correspond to usage on the plateform after 2015. The current usage metrics is available 48-96 hours after online publication and is updated daily on week days.
Initial download of the metrics may take a while.