Fig. 5
Download original image
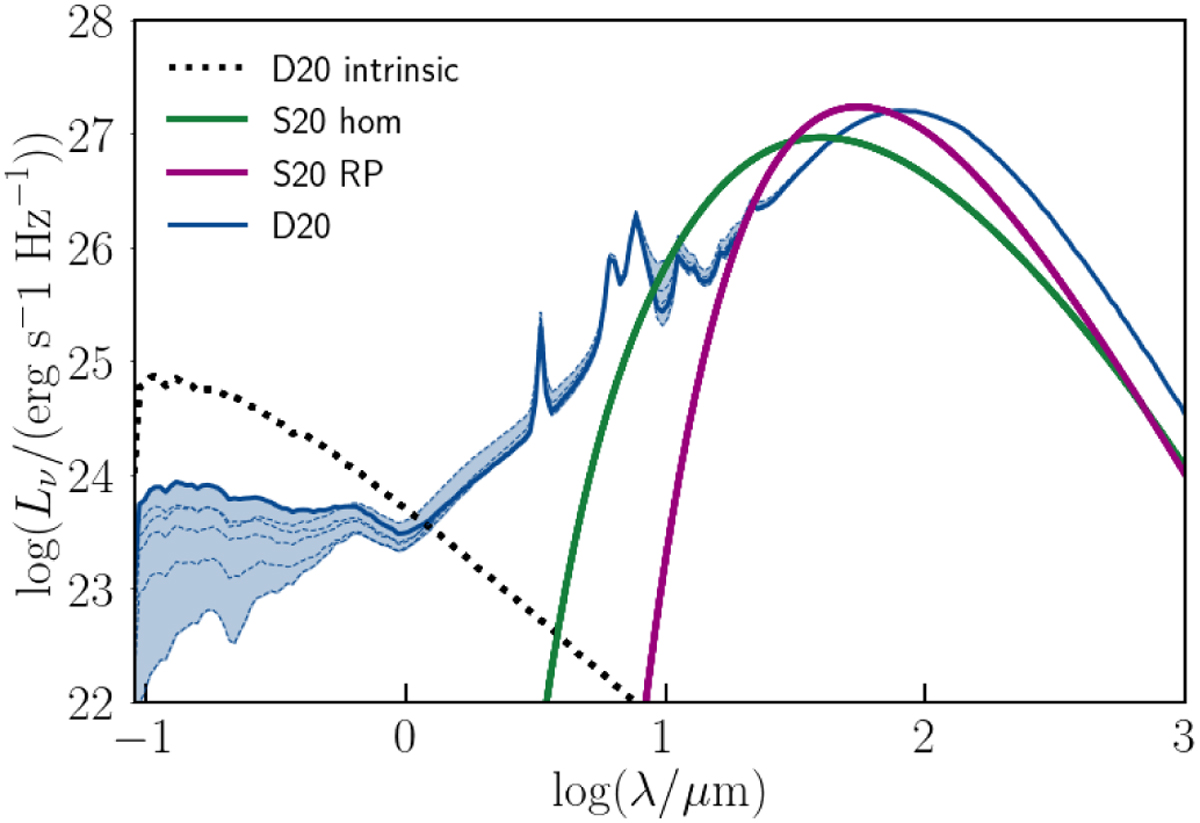
Cloud SED (Lν) for the reference snapshot as a function of wavelength (λ). The solid blue line shows the UV-to-FIR emission of the cloud obtained from the RT post-processed along the reference observing direction. The dashed blue lines correspond to the other five observing directions. The shaded area brackets the fluxes of all the observing directions adopted. The dashed black line indicates the intrinsic (dust-transparent) emission of the cloud along the same observing direction. As a reference, we also show the emission of a local cloud from the analytic model by S20 in the homogeneous case (green line) and in the radiation–pressure case (magenta line).
Current usage metrics show cumulative count of Article Views (full-text article views including HTML views, PDF and ePub downloads, according to the available data) and Abstracts Views on Vision4Press platform.
Data correspond to usage on the plateform after 2015. The current usage metrics is available 48-96 hours after online publication and is updated daily on week days.
Initial download of the metrics may take a while.