Fig. 4
Download original image
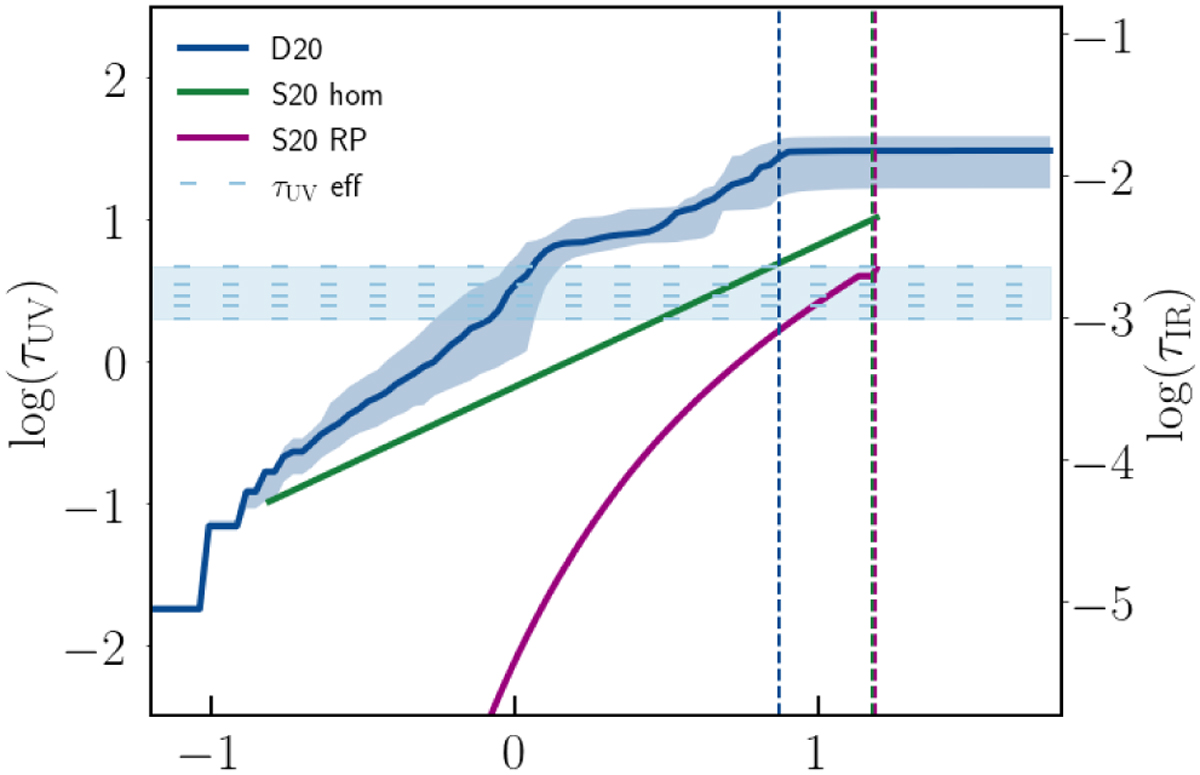
Absorption properties of the MC at the reference snapshot. UV optical depth (τUV at 1600 Å , left y axis) and IR optical depth (τIR, at 100 µm , right y axis) as a function of the cloud radius (r). The optical depths are computed along radial lines of sight from the center of the cloud, as is described in Sect. 3.2. The solid blue line gives the median value over 100 lines of sight, while the shaded region indicates the variance (16th–84th percentiles). The shape of the profiles of the UV and IR optical depths computed from the dust distribution is the same and the two profiles are simply re-scaled due to the different dust opacities in the two regimes: τUV/τIR = κ1600 Å/κ100 µm ≈ 2000. The shaded light blue area brackets the values of the effective optical depth for the six detectors’ observing directions, obtained as ![]() , where Fλ is the detected flux and Fλ,0 the flux that would be received without dust. We also plot with a dashed line the values of τeff for each detector’s observing direction. As a reference, we plot the corresponding optical depth profiles for the S20 model in the homogeneous case (green line) and in the radiation–pressure case (magenta line). The vertical dashed lines show the radius at which the optical depth reaches 90% of the total value in each model.
, where Fλ is the detected flux and Fλ,0 the flux that would be received without dust. We also plot with a dashed line the values of τeff for each detector’s observing direction. As a reference, we plot the corresponding optical depth profiles for the S20 model in the homogeneous case (green line) and in the radiation–pressure case (magenta line). The vertical dashed lines show the radius at which the optical depth reaches 90% of the total value in each model.
Current usage metrics show cumulative count of Article Views (full-text article views including HTML views, PDF and ePub downloads, according to the available data) and Abstracts Views on Vision4Press platform.
Data correspond to usage on the plateform after 2015. The current usage metrics is available 48-96 hours after online publication and is updated daily on week days.
Initial download of the metrics may take a while.