Fig. 2
Download original image
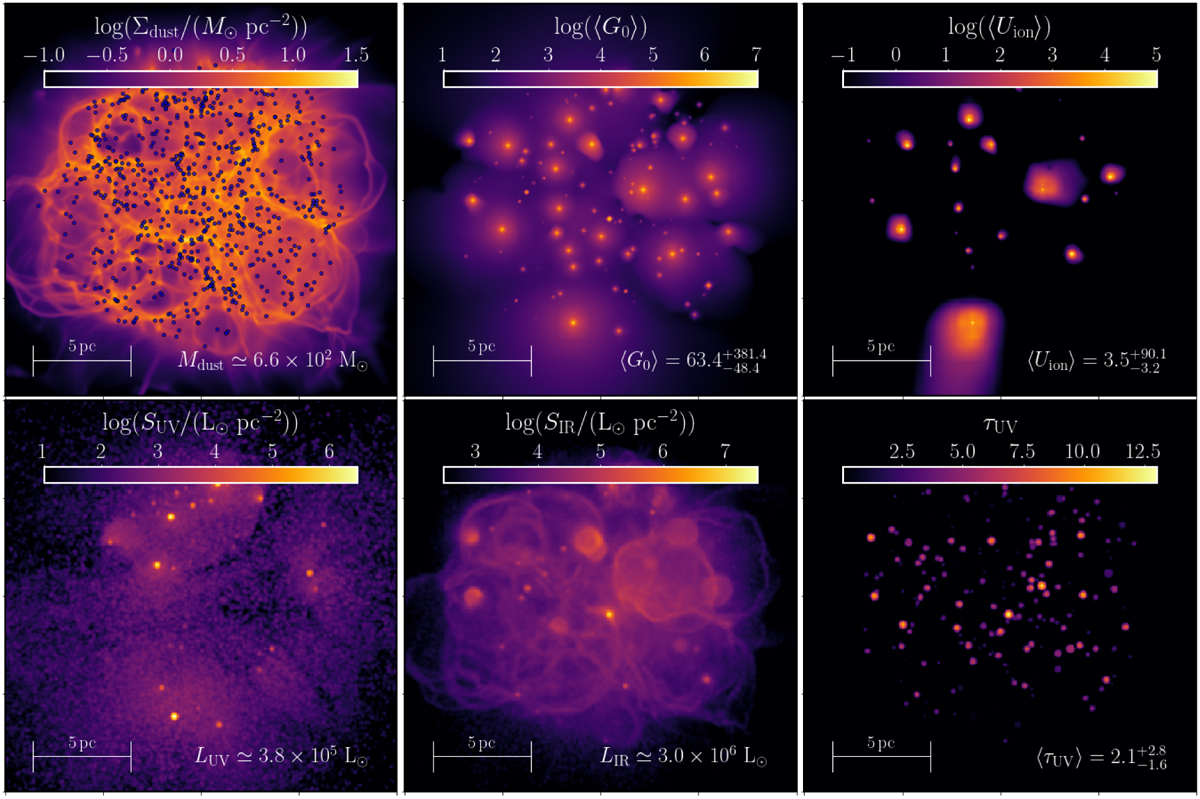
Morphology of the MC at the reference snapshot, zooming on the central region of the box with a side length of 20 pc. The maps refer to the reference observing direction. Top panels show the dust surface density (left panel), the photon density-weighted Habing flux G0 (middle panel) and the photon density-weighted ionizing flux Uion (right panel). Blue circles in the top left panel mark the position of stellar particles. The bottom panels show the UV emission (left panel), IR emission (middle panel), and V -band optical depth (right panel), computed from the post-processing RT. The maps in the bottom row are smoothed with a Gaussian kernel of σ = 1 pixel with respect to the original resolution. For the same diagnostics at different evolutionary times, see Figs. A.1, A.2, and A.3.
Current usage metrics show cumulative count of Article Views (full-text article views including HTML views, PDF and ePub downloads, according to the available data) and Abstracts Views on Vision4Press platform.
Data correspond to usage on the plateform after 2015. The current usage metrics is available 48-96 hours after online publication and is updated daily on week days.
Initial download of the metrics may take a while.