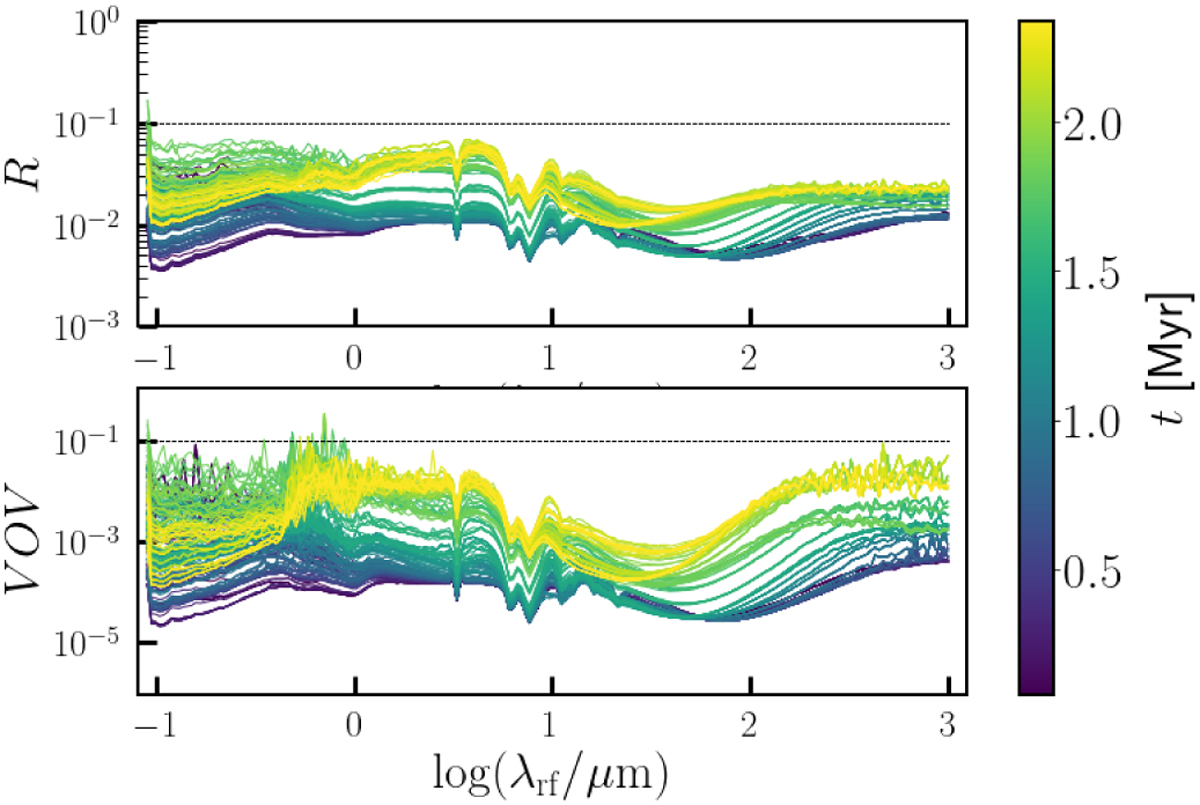
Fig. C.2
Download original image
SED statistics for each snapshot analyzed in this work. The top panel shows the relative error R, and the lower panel the variance of variance VOV. For every snapshot, we show the results relative to the SED of the 6 observing directions, and we color-code the lines relative to each snapshot according to the corresponding time since the beginning of the SF in the MC. The dashed lines in both panels indicate the threshold of 0.1 below which the results are reliable.
Current usage metrics show cumulative count of Article Views (full-text article views including HTML views, PDF and ePub downloads, according to the available data) and Abstracts Views on Vision4Press platform.
Data correspond to usage on the plateform after 2015. The current usage metrics is available 48-96 hours after online publication and is updated daily on week days.
Initial download of the metrics may take a while.