Fig. C.1
Download original image
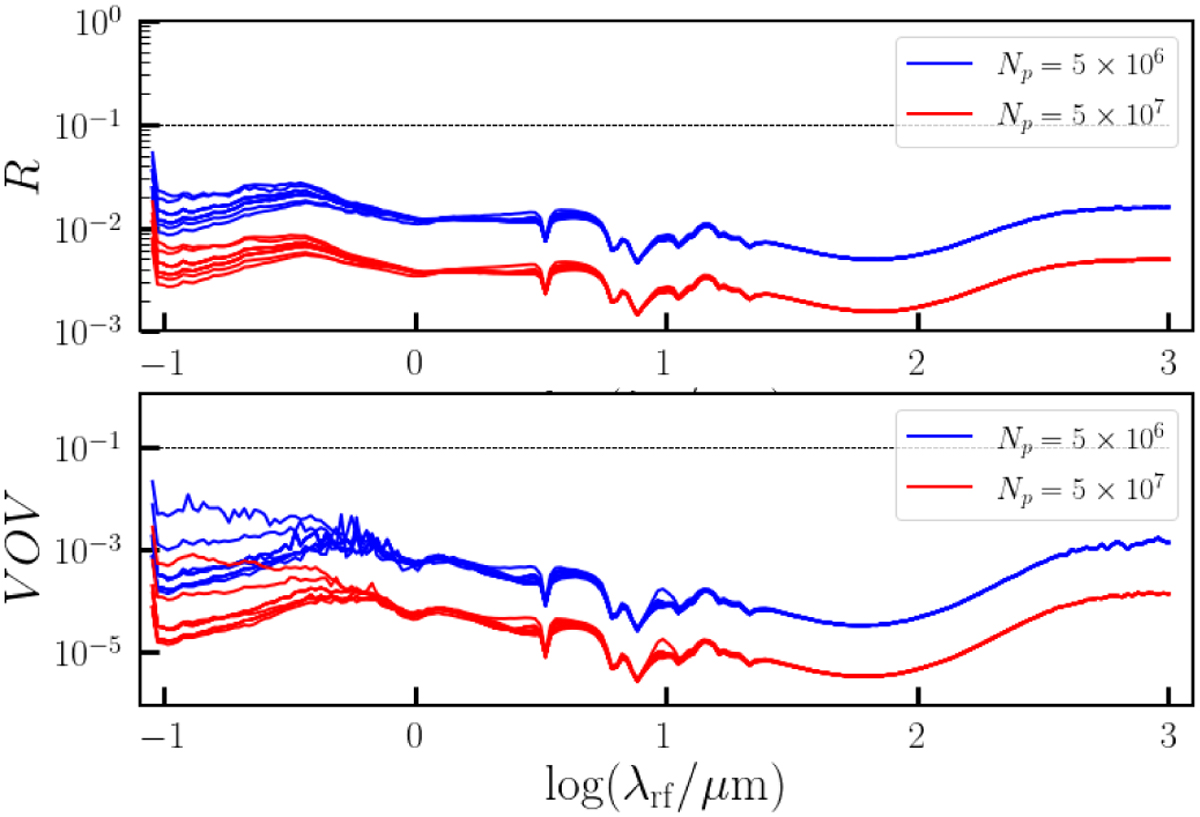
SED statistics for the reference snapshot. The top panel shows the relative error R, the lower panel shows the variance of variance VOV. Blue (red) lines represent the run with 5 × 10⁶ (5 × 10⁷) photon packets, with each line referring to a different observing direction. The dashed lines in both panels indicate the threshold of 0.1 below which the results are reliable.
Current usage metrics show cumulative count of Article Views (full-text article views including HTML views, PDF and ePub downloads, according to the available data) and Abstracts Views on Vision4Press platform.
Data correspond to usage on the plateform after 2015. The current usage metrics is available 48-96 hours after online publication and is updated daily on week days.
Initial download of the metrics may take a while.