Fig. B.1
Download original image
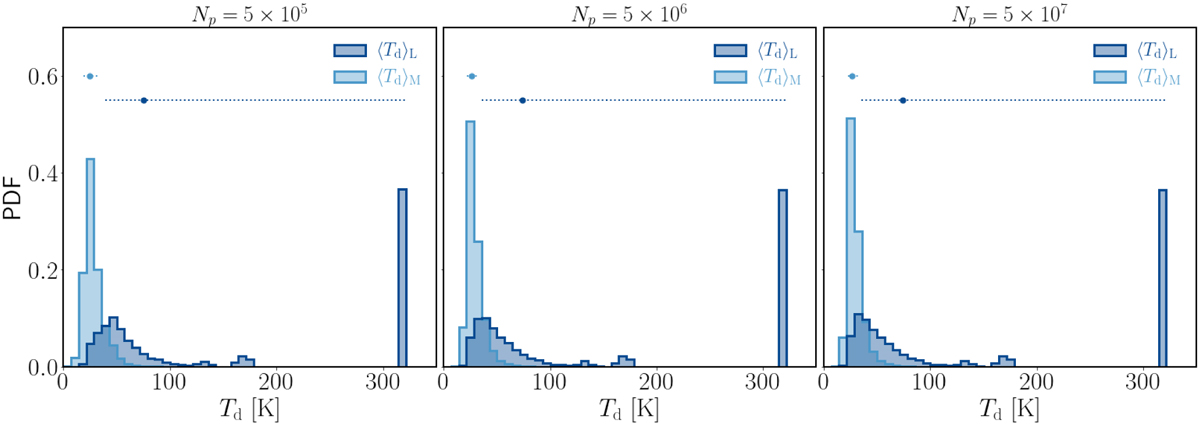
Probability distribution functions (PDFs) for the reference snapshot of the MC simulation. The PDFs are weighted by mass (light blue) and luminosity (blue). Each panel refers to the same snapshot at t ~ 1.1 Myr (the reference snapshot), simulated with 5 × 10⁵ (left panel), 5 × 10⁶ (middle panel), 5 × 10⁷ (right panel) photon packets. Circles indicate the median of each distribution, whereas the dotted lines bracket the 16th and 84th percentiles.
Current usage metrics show cumulative count of Article Views (full-text article views including HTML views, PDF and ePub downloads, according to the available data) and Abstracts Views on Vision4Press platform.
Data correspond to usage on the plateform after 2015. The current usage metrics is available 48-96 hours after online publication and is updated daily on week days.
Initial download of the metrics may take a while.