Fig. 13
Download original image
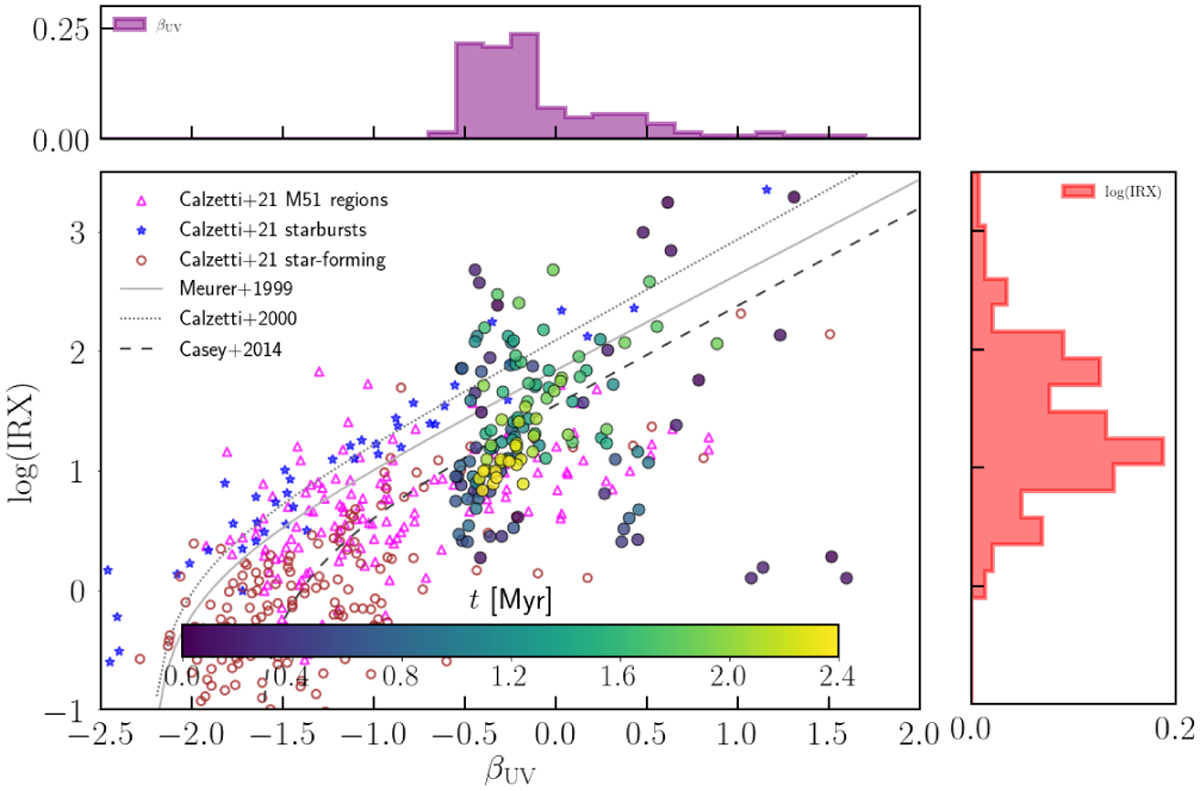
IRX-β relation during the evolution of the MC. For each snapshot, we computed the IRX-β values for each observing direction. We show all of them as circles, color-coded according to the time since the onset of SF. The upper and right insets show the 1-D PDF of βUV and IRX, respectively. We also show the data collected in Calzetti et al. (2021) relative to local starburst galaxies (Calzetti et al. 1994; Meurer et al. 1999, blue stars), nearby star-forming galaxies (Dale et al. 2009, brown circles) and individual star-forming regions in the local galaxy M51 (Calzetti et al. 2005, magenta triangles). We also show with gray lines the empirical fitting relations obtained by Meurer et al. (1999) and Calzetti et al. (2000) for their starbursts samples, and the relation from Casey et al. (2014) for local galaxies.
Current usage metrics show cumulative count of Article Views (full-text article views including HTML views, PDF and ePub downloads, according to the available data) and Abstracts Views on Vision4Press platform.
Data correspond to usage on the plateform after 2015. The current usage metrics is available 48-96 hours after online publication and is updated daily on week days.
Initial download of the metrics may take a while.