Fig. 12
Download original image
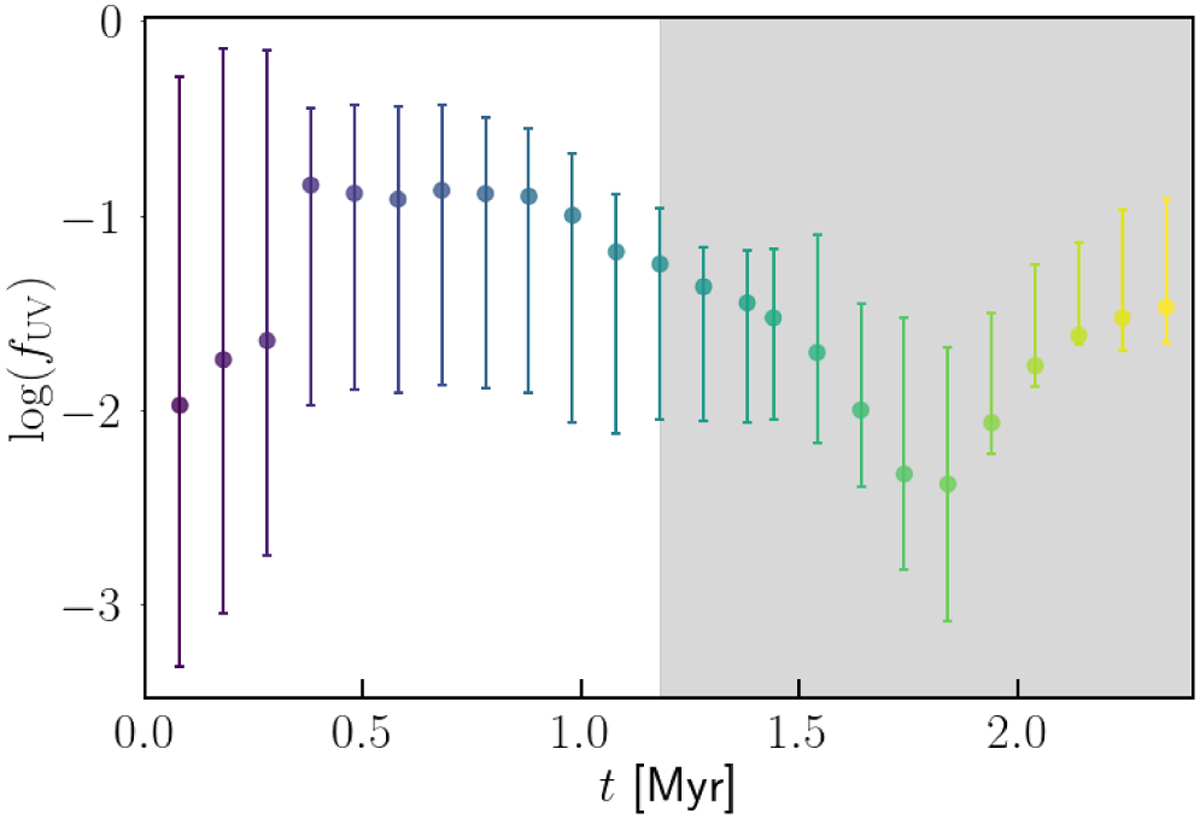
Evolution of the UV (0.1–0.3 µm) escape fraction for the simulated MC. Filled circles indicate the median escape fraction among the different observing directions, whereas error bars bracket the minimum and maximum escape fractions. The shaded area highlights the period when the cloud is dispersed according to the radiation–pressure model from S20 (cf. Sect. 2.3).
Current usage metrics show cumulative count of Article Views (full-text article views including HTML views, PDF and ePub downloads, according to the available data) and Abstracts Views on Vision4Press platform.
Data correspond to usage on the plateform after 2015. The current usage metrics is available 48-96 hours after online publication and is updated daily on week days.
Initial download of the metrics may take a while.