Fig. 10
Download original image
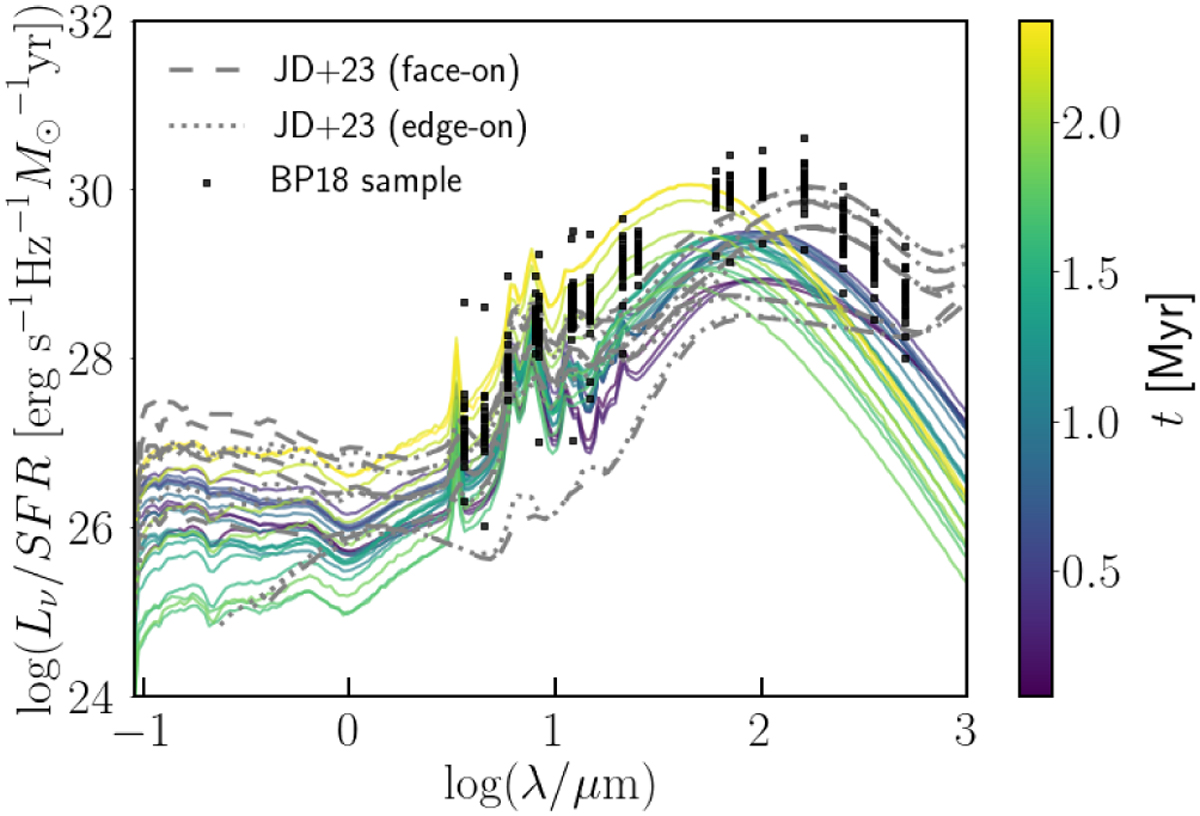
Evolution of the MC SED as a function of wavelength, normalized to the SFR. Each line corresponds to a different evolution time t of the MC, as is shown in the color bar. For the sake of clarity, at each t we show only the SED for the reference observing direction. Dashed gray lines show the results of the RT simulations by JD23 for their snapshots from 0.8 Myr to 7.5 Myr for their face-on view (dashed lines) and edge-on view (dotted lines). Black points indicate the photometric data relative to the 28 active clouds analyzed in Binder & Povich (2018).
Current usage metrics show cumulative count of Article Views (full-text article views including HTML views, PDF and ePub downloads, according to the available data) and Abstracts Views on Vision4Press platform.
Data correspond to usage on the plateform after 2015. The current usage metrics is available 48-96 hours after online publication and is updated daily on week days.
Initial download of the metrics may take a while.