Fig. 5
Download original image
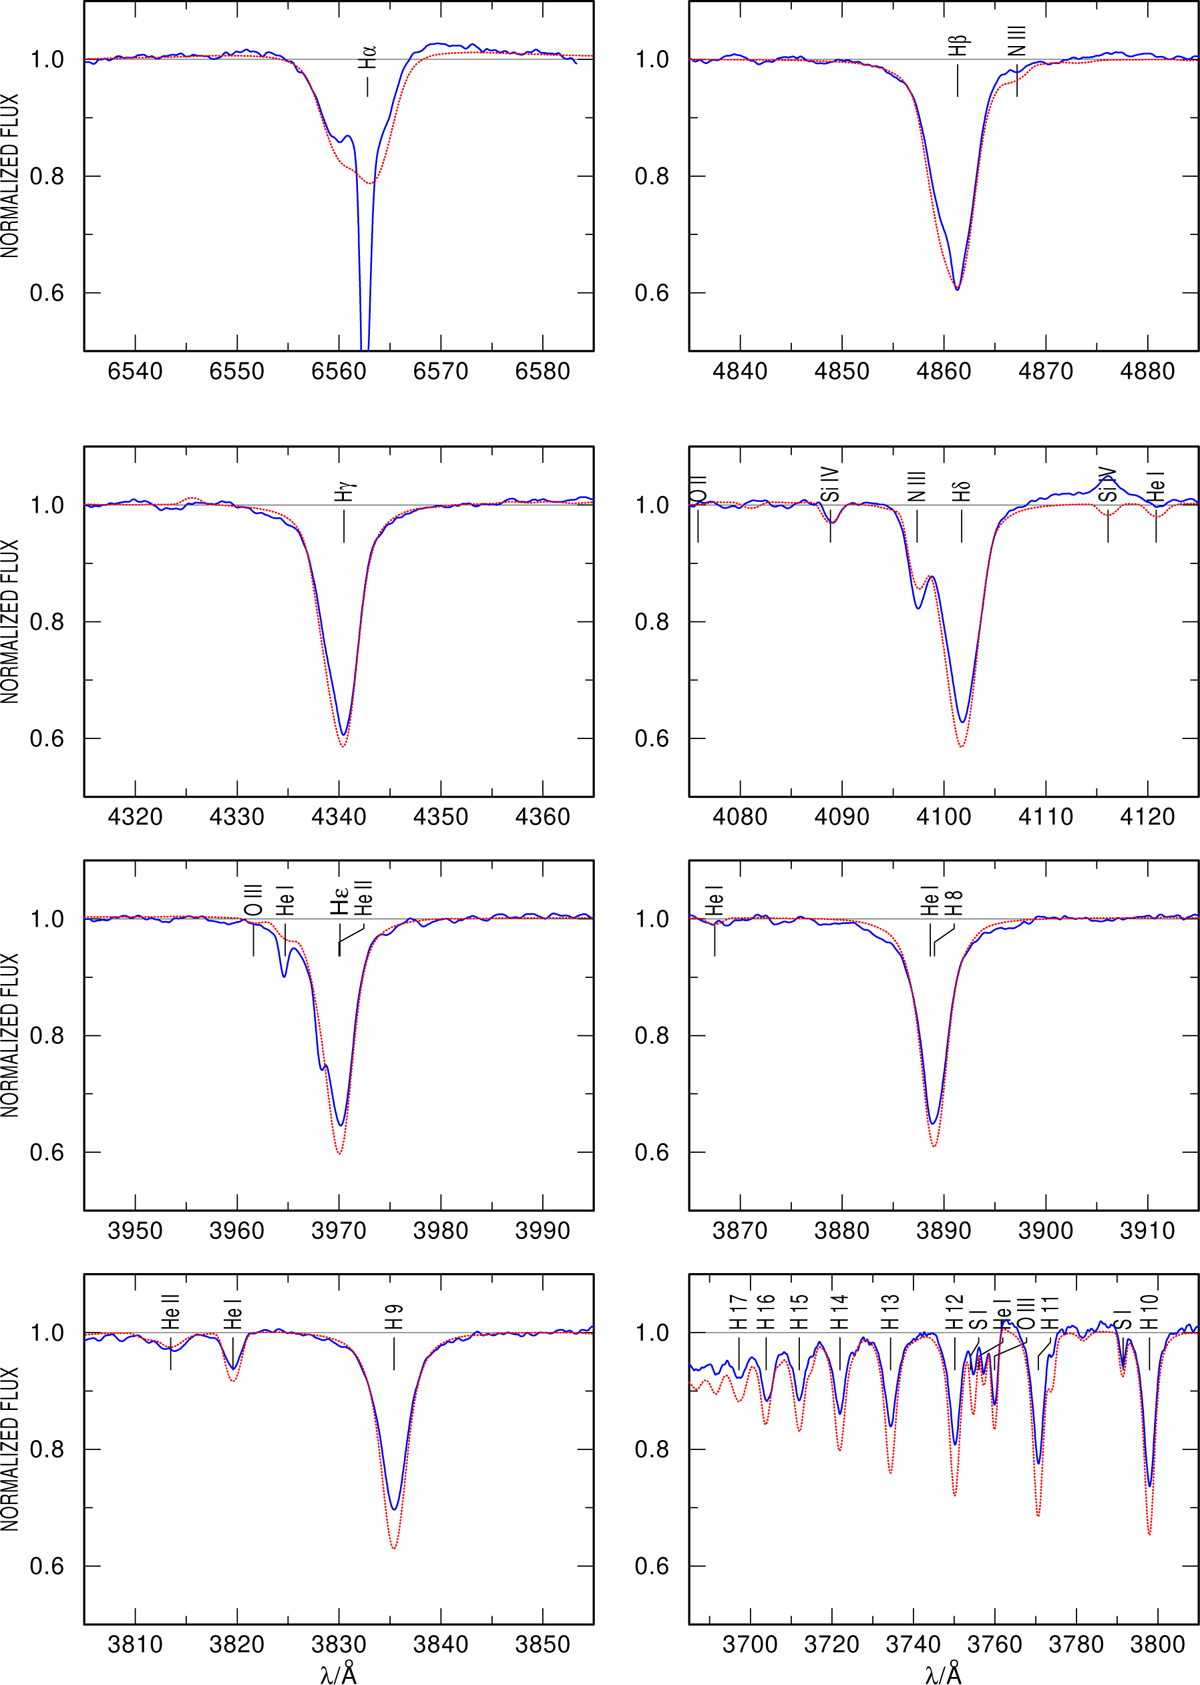
PoWR model for PGMW 3053. Several windows are displayed to show the Balmer lines present in the observed spectrum in detail: Hα, Hβ, Hγ, Hδ, Hє, and H10–H17, in comparison with the final model of the star. The surface gravity (log g) parameter of the star is determined from the wings of the H lines. In this particular case, Hγ is the optimal line to use, given that it is not blended with other lines (e.g., Hβ, Hδ, Hє), and is also more intense than H8–H17. Hα is the most intense H line, although it is sensitive to the stellar winds and is therefore considered to determine mass-loss rate (Ṁ). The Hα line is affected by a strong feature in absorption, most likely by the nebular emission subtraction. The observed spectra are shown by a blue line and the PoWR model by a red dashed line. The most important lines are identified.
Current usage metrics show cumulative count of Article Views (full-text article views including HTML views, PDF and ePub downloads, according to the available data) and Abstracts Views on Vision4Press platform.
Data correspond to usage on the plateform after 2015. The current usage metrics is available 48-96 hours after online publication and is updated daily on week days.
Initial download of the metrics may take a while.