Fig. 4
Download original image
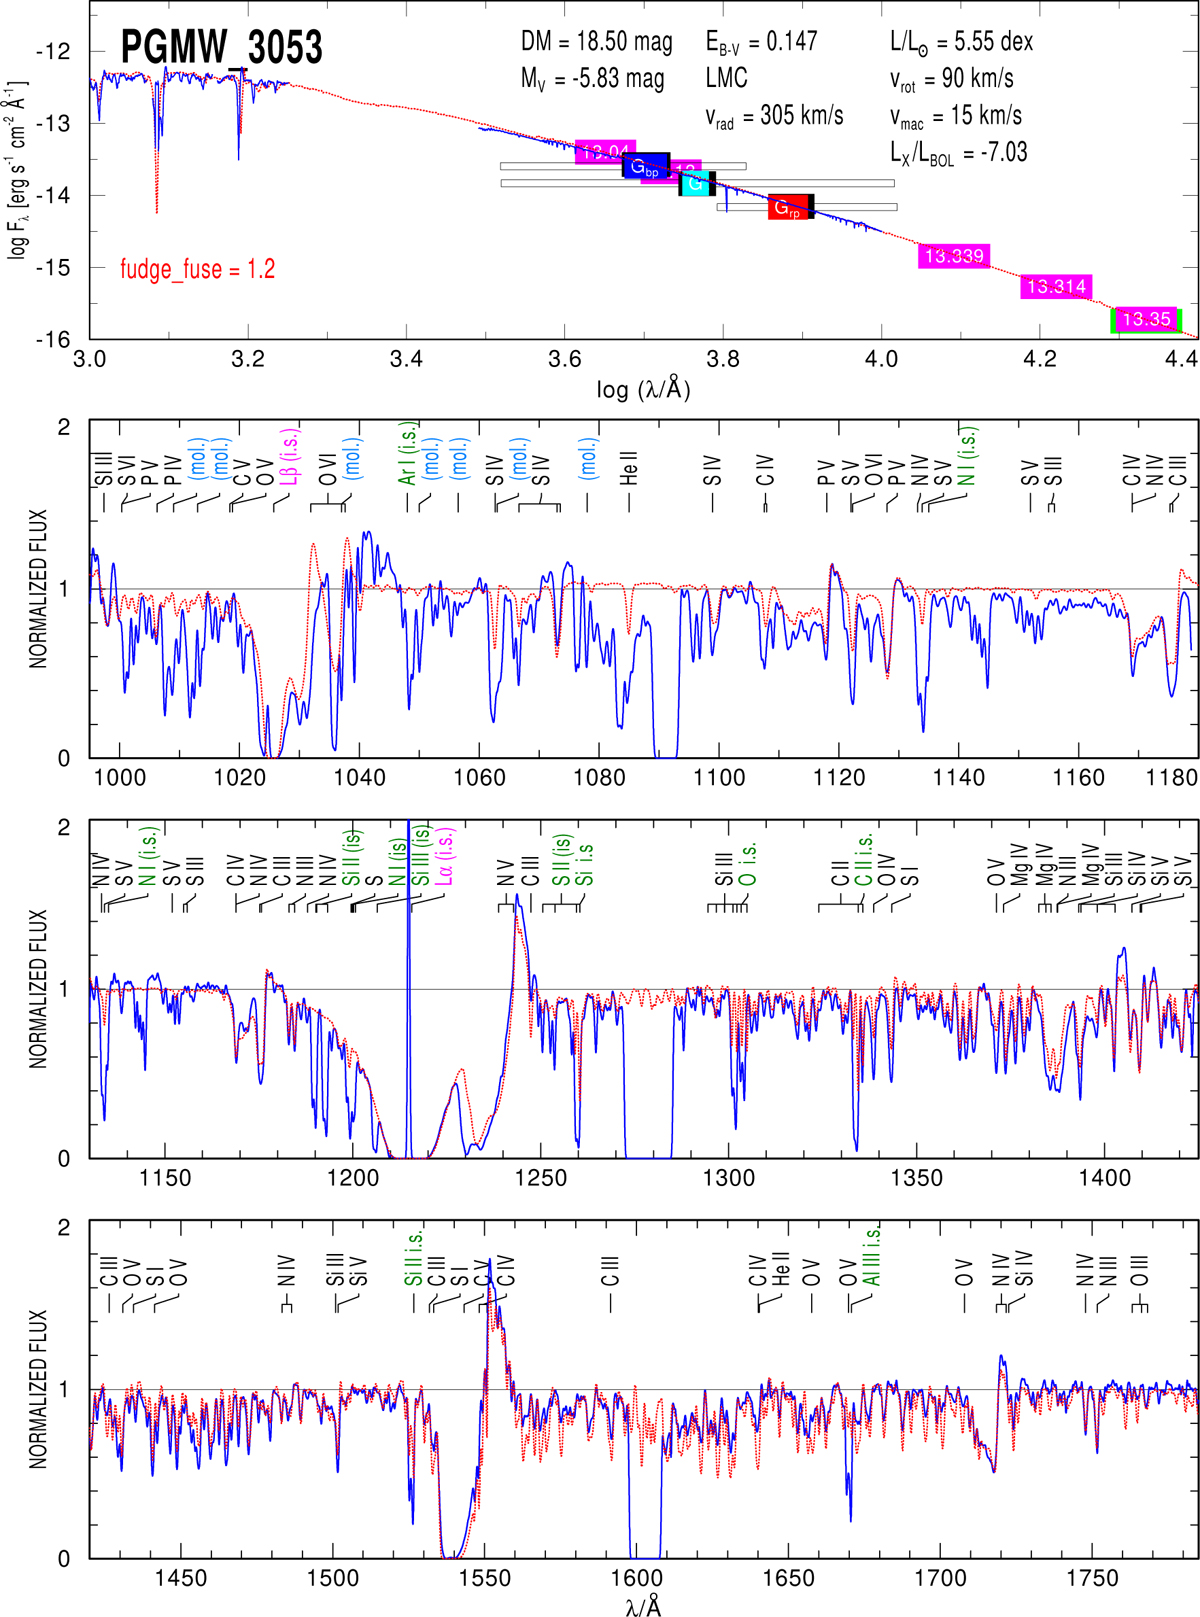
PoWR model for the star PGMW 3053. The observed spectrum is shown by a blue line and the model by a red dashed line. (First panel) SED with photometric magnitudes (colored boxes). The UV spectra better constrain the E(B − V) and L⋆ of the star (also indicated at the upper right, among other parameters). The widths of the Gaia DR3 filters (blue, central, and red arms) are also indicated. (Second panel) FUSE/MRDS UV spectrum normalized to the continuum model. (Third and fourth panels) HST/COS UV spectrum normalized to the continuum model. The terminal velocity (v∞) is determined from the blue edge of the C IV line in absorption. Nitrogen enhancement is determined with N III at 1183 and 1185 Å, also considering these ions in the optical range, and the carbon abundances is determined using C III at 1175 and 1176 Å in the UV. The N V λλ1238.8,1242.8 and O VI λλ1031.9,1037.6 features are particularly sensitive to X-rays. We also considered ISM absorption features by the hydrogen Lyman lines in our modeling. Interstellar (i.s.) atomic, molecular, and metal lines in absorption are indicated. The legend “fudge” means that the FUSE spectrum had to be scaled by 1.2 for comparison purposes in the second panel. There is a gap of around 10 Å in the observations around 1090, 1280, and 1605 Å, where no key lines are present. See text for details.
Current usage metrics show cumulative count of Article Views (full-text article views including HTML views, PDF and ePub downloads, according to the available data) and Abstracts Views on Vision4Press platform.
Data correspond to usage on the plateform after 2015. The current usage metrics is available 48-96 hours after online publication and is updated daily on week days.
Initial download of the metrics may take a while.