Fig. 3
Download original image
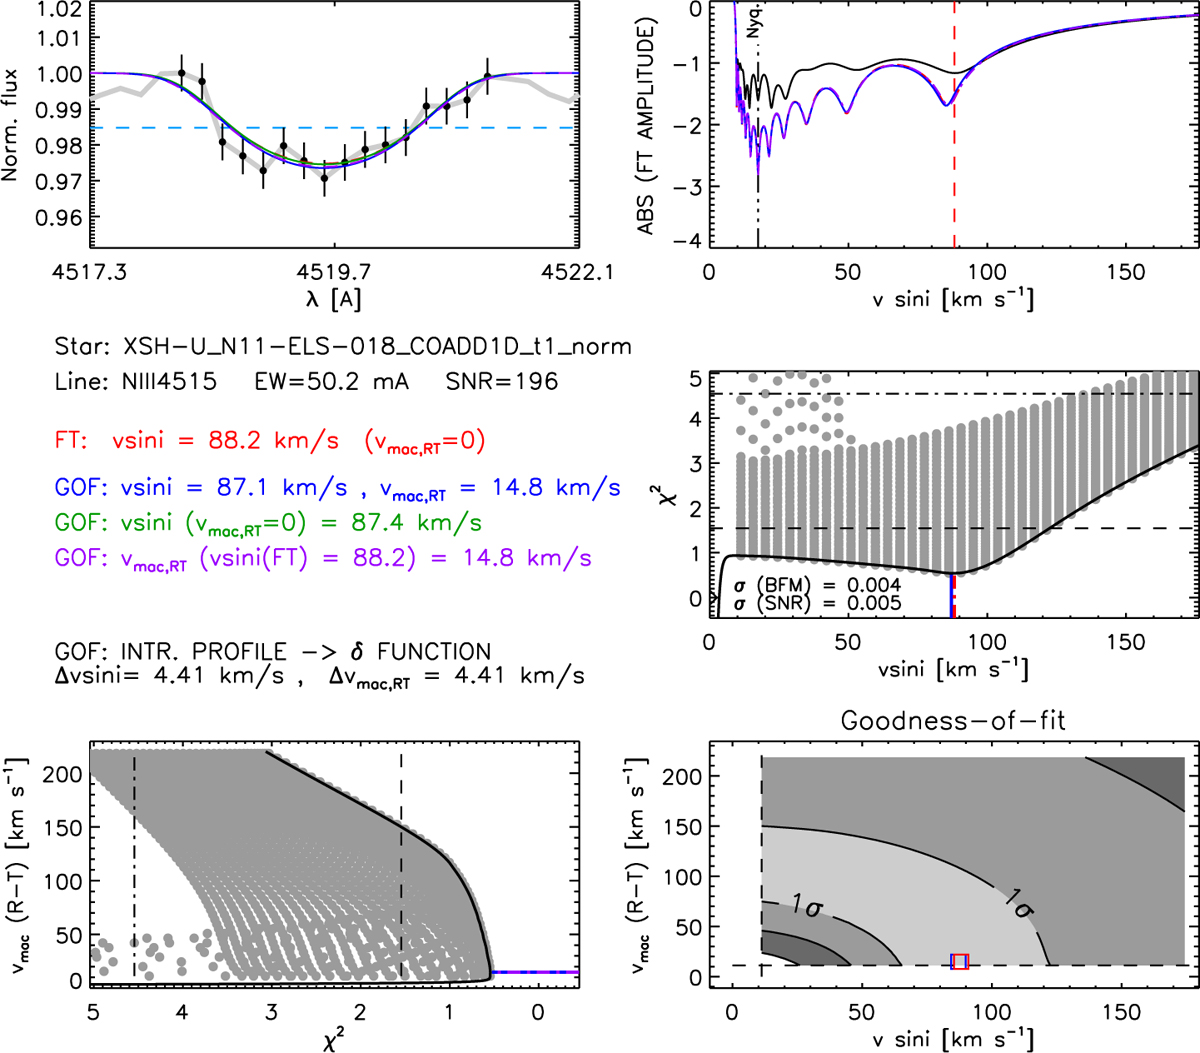
Graphical output from the iacob-broad semi-automatized tool to determine projected rotational velocity (3 sin i) and non-rotational broadening. The example shown is for the star PGMW 3053, using the metal line of N III λ4515 in absorption. Five panels are displayed: (upper left) the line profile of the line; (upper right) the Fourier transform (FT) of the line; (lower right) 2D χ-distributions resulting from the Goodness-of-fit (GOF) analysis, and their projections (middle and lower left). The fitting in red indicates the v sin i corresponding to the first zero of the FT; the blue indicates the result for v sin i and “macroturbulent” velocity (vmac) from GOF; green indicates the result for v sin i from the GOF, if vmac is assumed to be zero; and purple shows the vmac from the GOF assuming v sin i is the first zero of the FT. The equivalent width (EW) and S/N measured in the neighboring continuum of the line are also indicated. In this case, EW = 50 mÅ and S/N = 196. Here, we take the v sin i value determined with the FT, and the vmac from the GOF, the fitting of which is shown in purple. Thus, for this star, we report v sin i = 88 ± 4 km s−1, and vmac = 15 ± 4 km s–1.
Current usage metrics show cumulative count of Article Views (full-text article views including HTML views, PDF and ePub downloads, according to the available data) and Abstracts Views on Vision4Press platform.
Data correspond to usage on the plateform after 2015. The current usage metrics is available 48-96 hours after online publication and is updated daily on week days.
Initial download of the metrics may take a while.