Fig. 2
Download original image
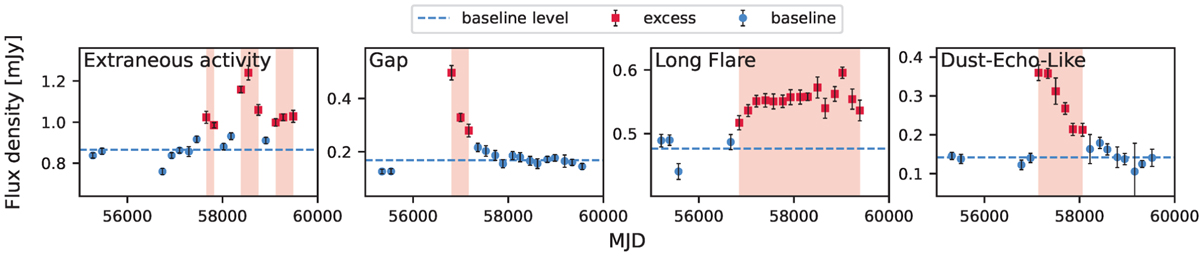
Representative examples of the classification of the pipeline outlined in Fig. 1 for steps 3 (WISEA J063233+655809), 5 (WISEA J105052+000134), and 10 (WISEA J144620+371159) from left to right detailed in Sect. 2.3, which impact the completeness (see Sect. 4). The last panel shows one example of a dust echo-like flare (WISEA J083416-054249). The flux density in the W1 band is shown against time. The classification is annotated in the upper left corner.
Current usage metrics show cumulative count of Article Views (full-text article views including HTML views, PDF and ePub downloads, according to the available data) and Abstracts Views on Vision4Press platform.
Data correspond to usage on the plateform after 2015. The current usage metrics is available 48-96 hours after online publication and is updated daily on week days.
Initial download of the metrics may take a while.