Fig. C.1
Download original image
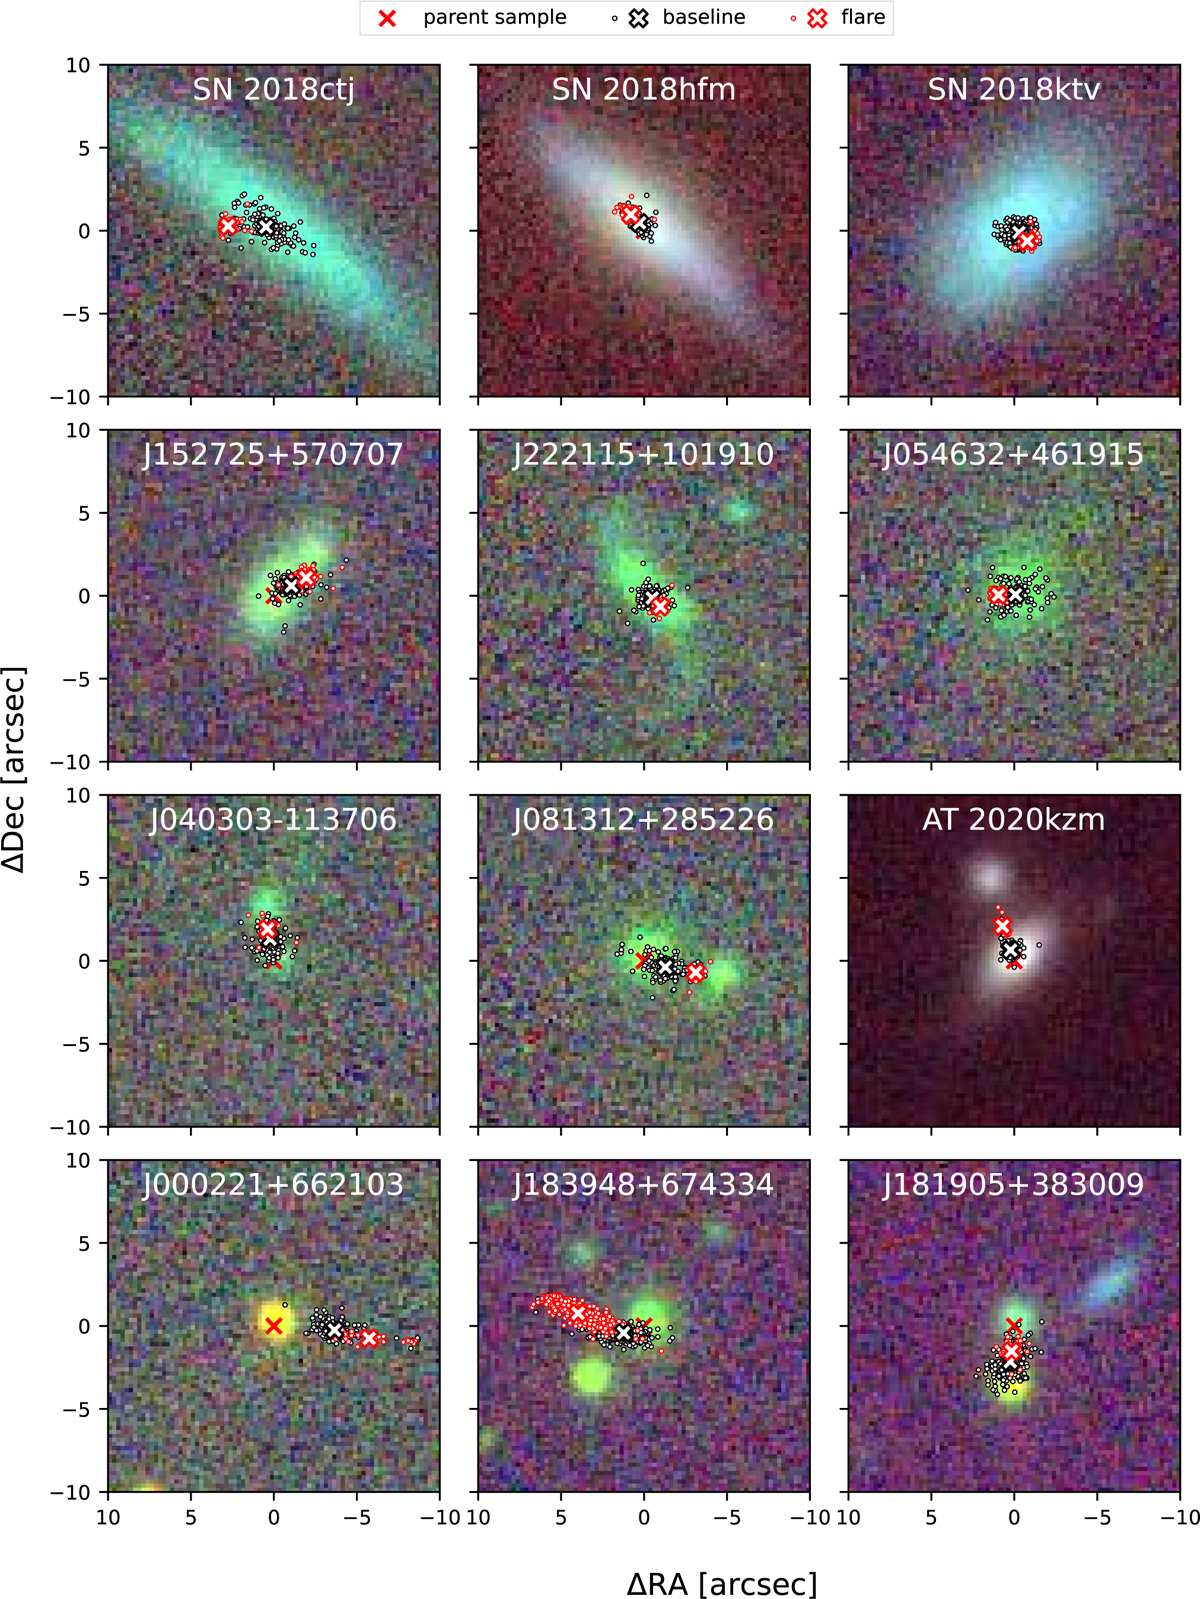
Pan-STARRS cutouts around the parent sample position of flares with a high angular offset. The red solid cross marks the position of the parent sample galaxy, the black and red circles the position of the single exposure photometry associated with the baseline and the flare, respectively, and the black and red filled cross the respective mean position.
Current usage metrics show cumulative count of Article Views (full-text article views including HTML views, PDF and ePub downloads, according to the available data) and Abstracts Views on Vision4Press platform.
Data correspond to usage on the plateform after 2015. The current usage metrics is available 48-96 hours after online publication and is updated daily on week days.
Initial download of the metrics may take a while.