Fig. 10
Download original image
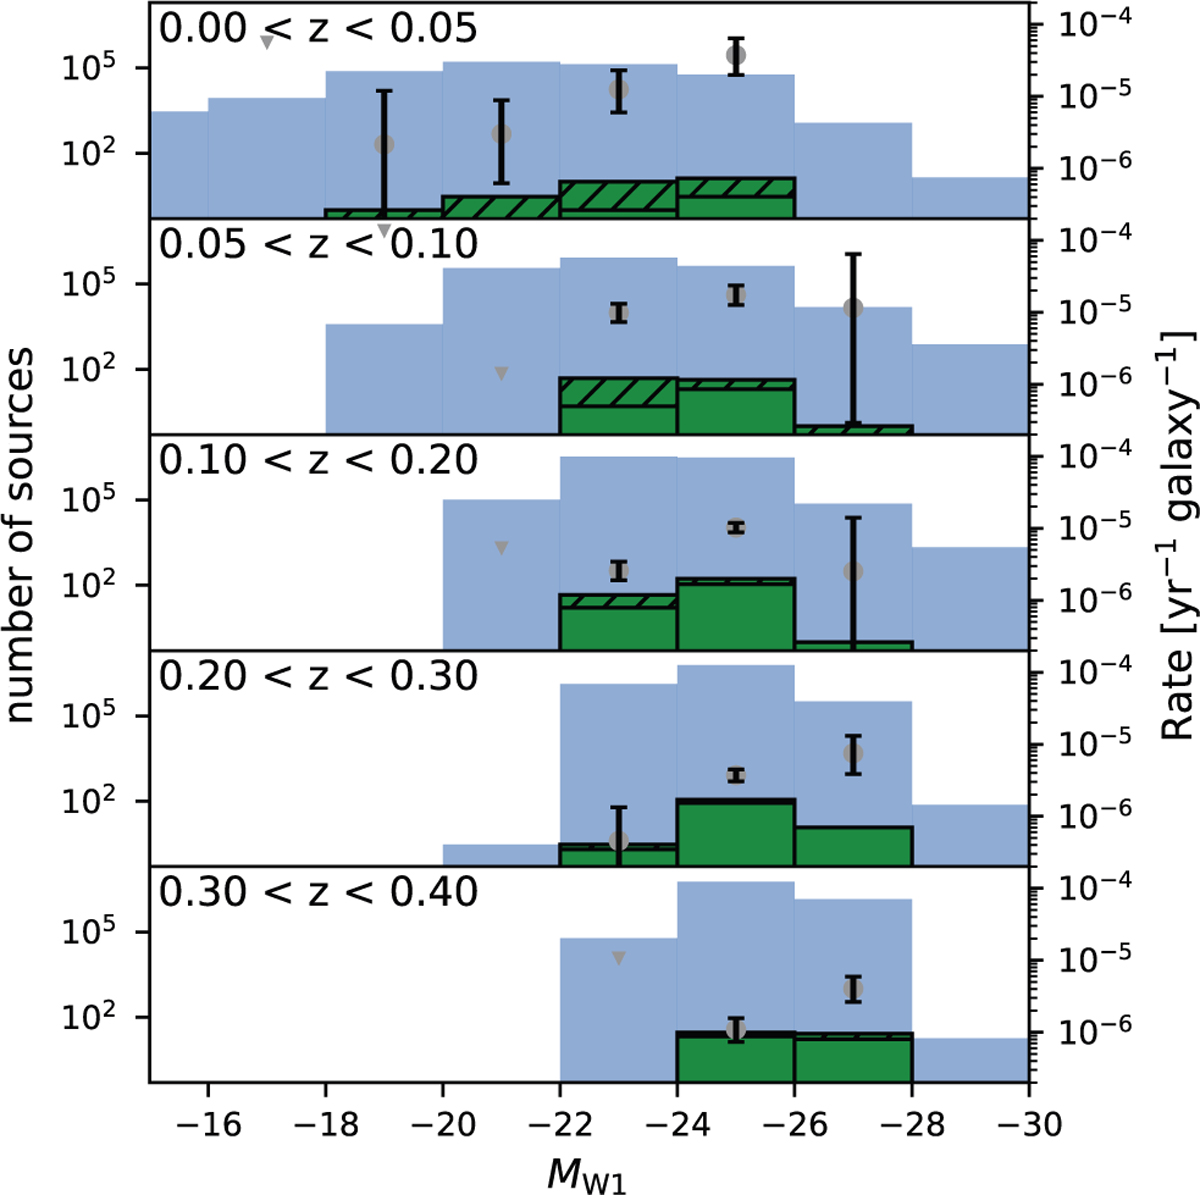
Rate as a function of the absolute magnitude in W1 and redshift. The light blue histogram shows the total number of galaxies in the parent galaxy sample and the green one is the host of our flare sample. The black hatched bars represent flares with Lbol,peak < 6 × 1043 erg. The grey data points and black errors show the rate as calculated with Eq. (12). The grey triangles are the 90% upper limit on the rate where no flare was observed. The errors are statistical only.
Current usage metrics show cumulative count of Article Views (full-text article views including HTML views, PDF and ePub downloads, according to the available data) and Abstracts Views on Vision4Press platform.
Data correspond to usage on the plateform after 2015. The current usage metrics is available 48-96 hours after online publication and is updated daily on week days.
Initial download of the metrics may take a while.