Fig. 13.
Download original image
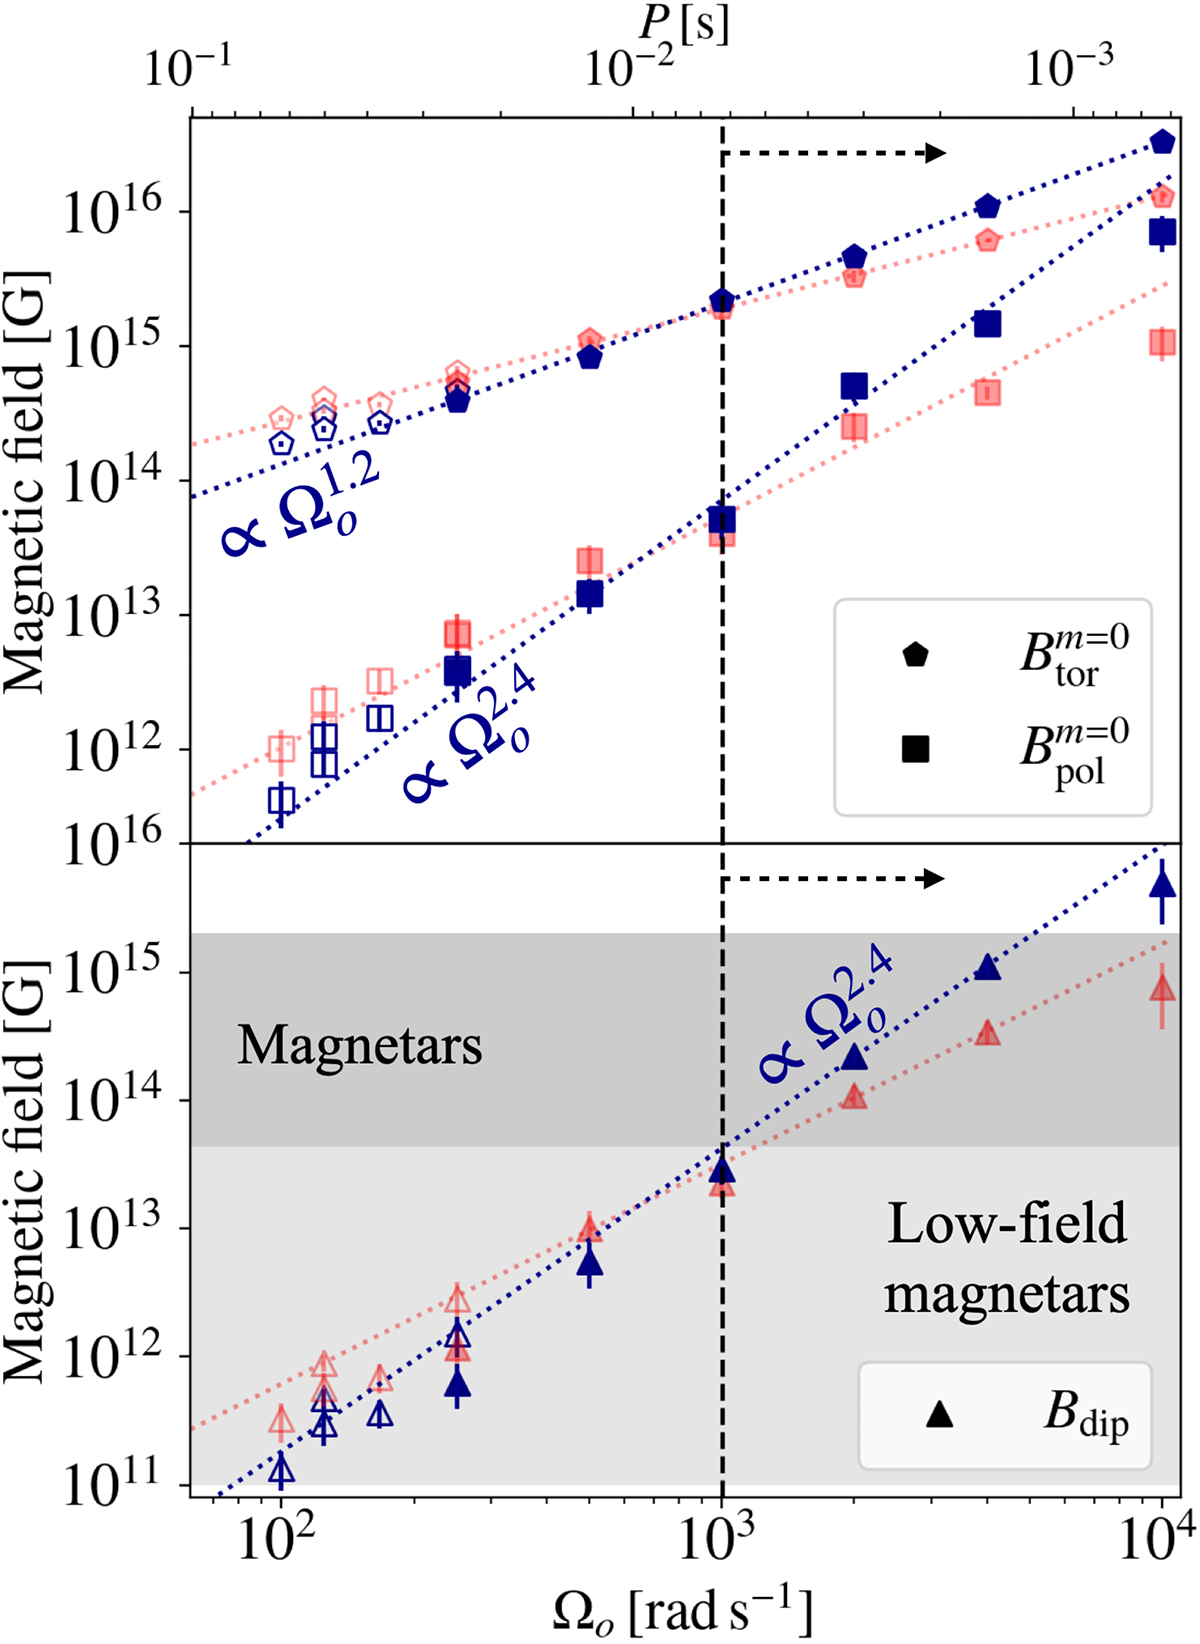
Magnetic strength of the axisymmetric toroidal, ![]() (pentagons), and poloidal,
(pentagons), and poloidal, ![]() (squares), components (upper panel), as well as that of the magnetic dipole, Bdip (triangles, lower panel), as a function of the angular frequency of the outer sphere, which represents the PNS surface. The red markers correspond to the magnetic field measured in the simulations, while the blue markers correspond to the values extrapolated to q = 1. The dotted lines are the best power-law fit of the data. The dark and light grey regions represent the range of magnetic field for classical magnetars (Bdip ≥ 4.4 × 10¹³ G) and low-field magnetars (
(squares), components (upper panel), as well as that of the magnetic dipole, Bdip (triangles, lower panel), as a function of the angular frequency of the outer sphere, which represents the PNS surface. The red markers correspond to the magnetic field measured in the simulations, while the blue markers correspond to the values extrapolated to q = 1. The dotted lines are the best power-law fit of the data. The dark and light grey regions represent the range of magnetic field for classical magnetars (Bdip ≥ 4.4 × 10¹³ G) and low-field magnetars (![]() ). The black dashed line and arrow illustrate the rotation period below which the dynamo can form classical magnetar-like magnetic fields. Filled and empty markers represent self-sustained and transient dynamos, respectively.
). The black dashed line and arrow illustrate the rotation period below which the dynamo can form classical magnetar-like magnetic fields. Filled and empty markers represent self-sustained and transient dynamos, respectively.
Current usage metrics show cumulative count of Article Views (full-text article views including HTML views, PDF and ePub downloads, according to the available data) and Abstracts Views on Vision4Press platform.
Data correspond to usage on the plateform after 2015. The current usage metrics is available 48-96 hours after online publication and is updated daily on week days.
Initial download of the metrics may take a while.