Fig. 6
Download original image
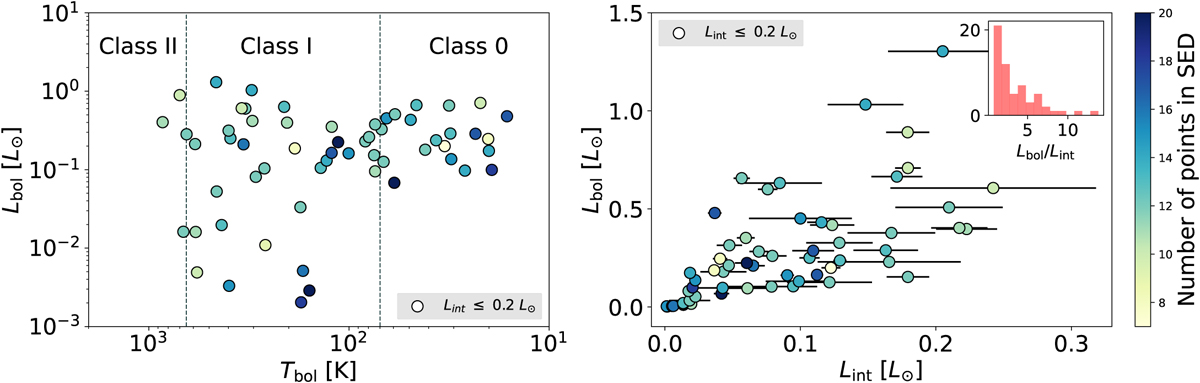
Bolometric luminosities versus the bolometric temperatures and internal luminosities of a subsample of SUCANES objects. Left: Lbol–Tbol diagram with 59 objects from SUCANES with well-sampled SEDs and Lint< 0.2 L⊙ (circles). The dotted vertical lines represent the Tbol values used to classify Class 0/I/II objects according to Chen et al. (1995). Right: Lbol versus Lint for the SUCANES objects with Lint ≤ 0.2 L⊙. The inset histogram represents the distribution of Lbol/Lint ratios for the represented objects. The colours of the circles in the two panels represent the number of data points used to build the SEDs of the objects.
Current usage metrics show cumulative count of Article Views (full-text article views including HTML views, PDF and ePub downloads, according to the available data) and Abstracts Views on Vision4Press platform.
Data correspond to usage on the plateform after 2015. The current usage metrics is available 48-96 hours after online publication and is updated daily on week days.
Initial download of the metrics may take a while.