Fig. 1
Download original image
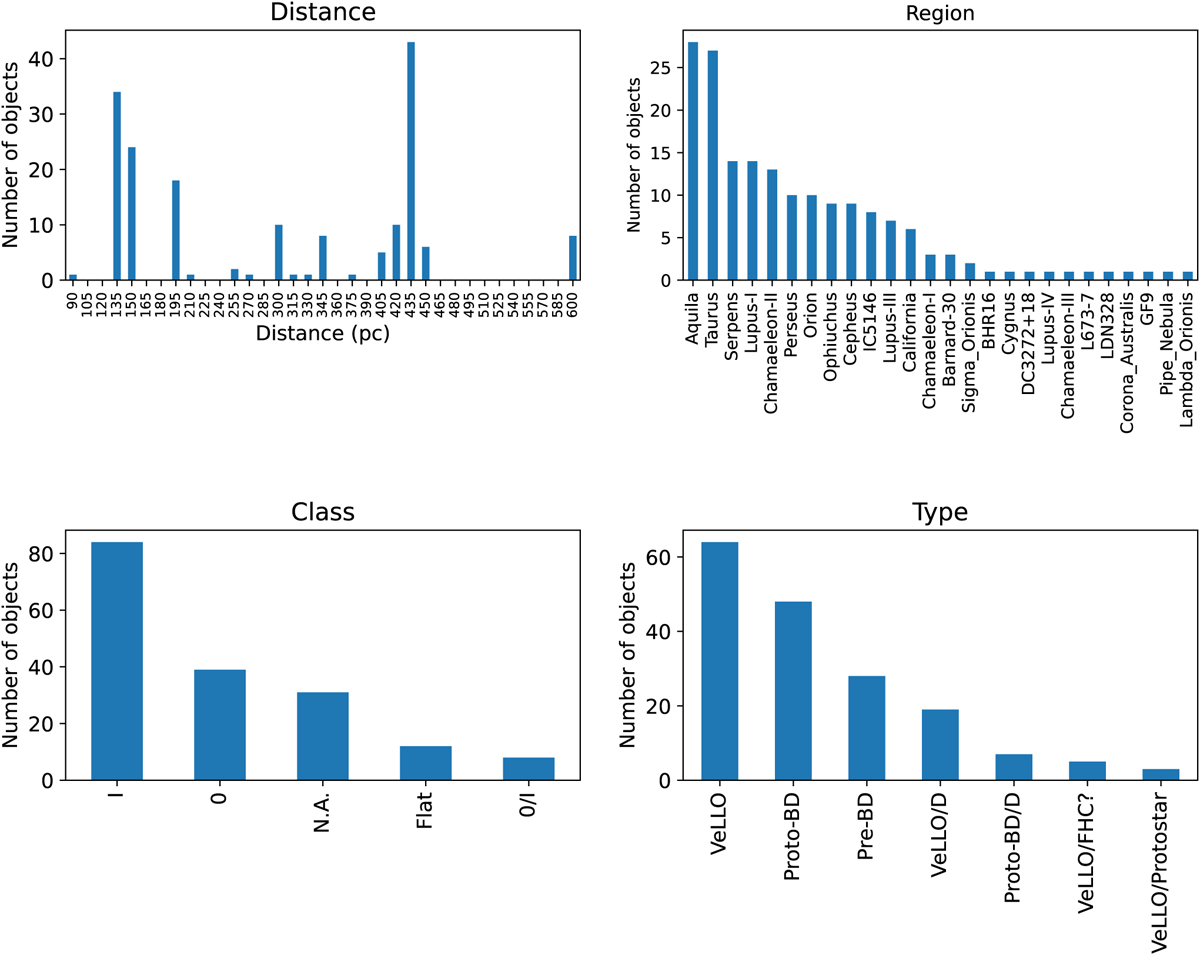
Histograms displaying main properties of objects included in SUCANES. The top panels show the distribution of distances and the star-forming region or the associations the objects belong to. The bottom panels display the evolutionary stage of the objects through the derived ‘class’ parameter (see Sect. 2.1), while the classification of the sources as derived in the different publications is shown in the ‘type’ histogram.
Current usage metrics show cumulative count of Article Views (full-text article views including HTML views, PDF and ePub downloads, according to the available data) and Abstracts Views on Vision4Press platform.
Data correspond to usage on the plateform after 2015. The current usage metrics is available 48-96 hours after online publication and is updated daily on week days.
Initial download of the metrics may take a while.