Fig. 8.
Download original image
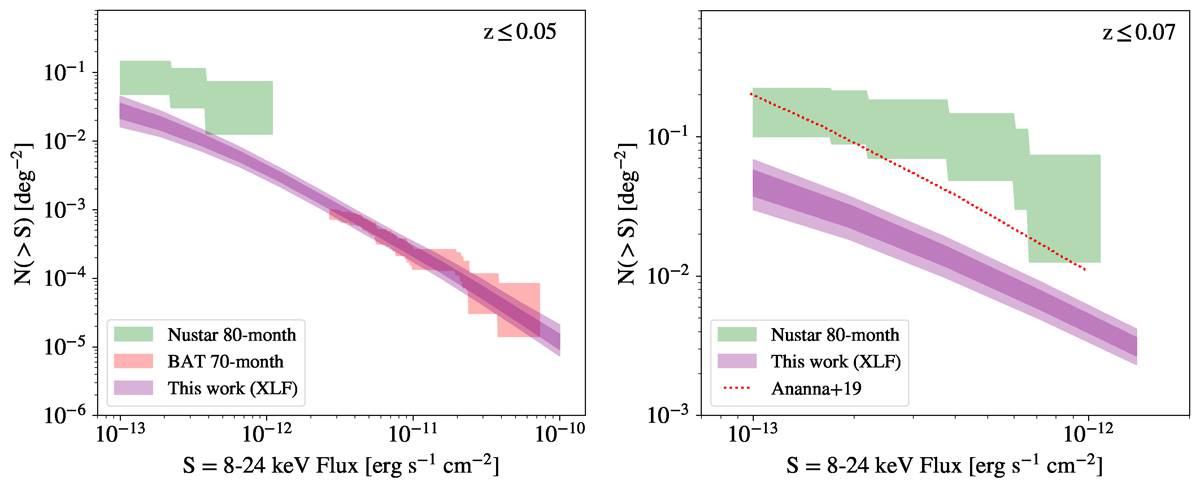
Observed and predicted number counts in the 8–24 keV band. (a) Left: Redshift range z < 0.05. The BAT 70-month survey number counts are plotted (red shaded diagram) together with the predictions of our luminosity function (shaded curve). The NuSTAR number counts are shown with the green diagram. (b) Right: Redshift range z < 0.07. The green shaded diagram corresponds to the NuSTAR number counts. The predictions of our luminosity function are depicted with the shaded curve. The red dotted line denotes the predictions of the X-ray background synthesis model of Ananna et al. (2019) in the 1024 − 1026 cm−2 column density range.
Current usage metrics show cumulative count of Article Views (full-text article views including HTML views, PDF and ePub downloads, according to the available data) and Abstracts Views on Vision4Press platform.
Data correspond to usage on the plateform after 2015. The current usage metrics is available 48-96 hours after online publication and is updated daily on week days.
Initial download of the metrics may take a while.