Fig. 6.
Download original image
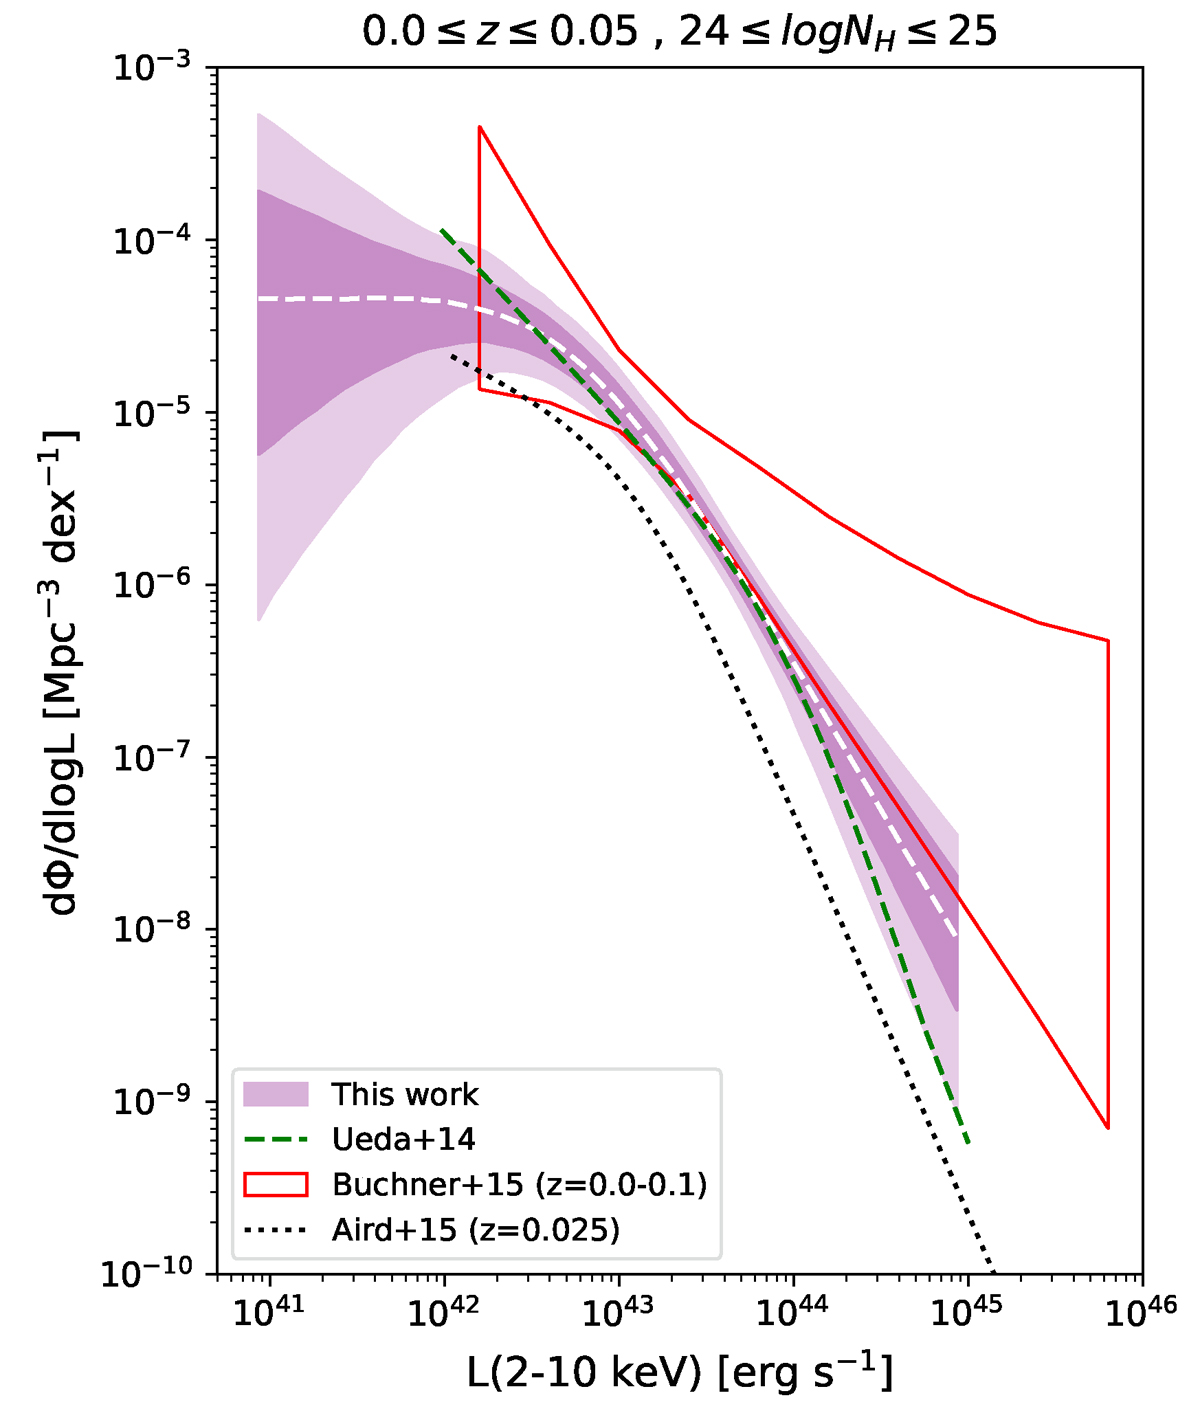
X-ray luminosity function (logNH[cm−2] = 24 − 25) in the 2–10 keV band. The shaded regions represent the 68% and 95% confidence intervals. The green dash line corresponds to the Compton-thick luminosity function of Ueda et al. (2014). The dotted line denotes the luminosity function of Aird et al. (2015a). Finally, the red fish-shaped diagram corresponds to the luminosity function of Buchner et al. (2014) (see text for details).
Current usage metrics show cumulative count of Article Views (full-text article views including HTML views, PDF and ePub downloads, according to the available data) and Abstracts Views on Vision4Press platform.
Data correspond to usage on the plateform after 2015. The current usage metrics is available 48-96 hours after online publication and is updated daily on week days.
Initial download of the metrics may take a while.