Fig. 8.
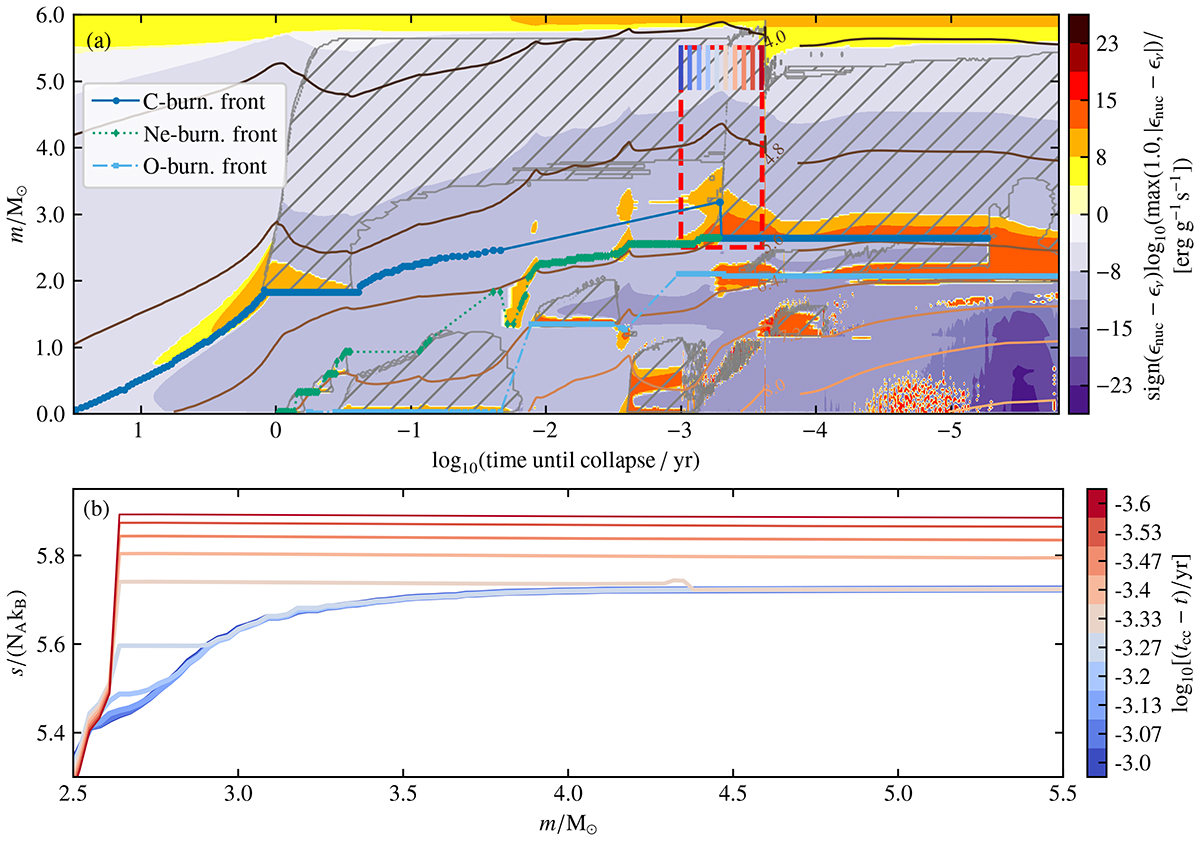
Download original image
Final evolution of the inner stellar structure of the model with XC = 0.17 which experiences a shell merger between the C and Ne-burning shells (highlighted in the red box in panel a). (a) Kippenhahn diagram in which colors indicate the regions dominated by nuclear burning or neutrino losses and gray hatched regions indicate convective areas. Brown lines show contours of constant (logarithmic) density. Colored markers trace the burning front for C, Ne, and O burning. Small colored vertical lines indicate the times at which the entropy profiles are shown in the bottom panel. (b) Entropy profiles in the mass and time range highlighted in the red box in the top panel. The entropy in the neon-burning region (2.5 − 2.9 M⊙) gradually increases until it exceeds the entropy of the C-burning layers above, triggering a merger between these regions.
Current usage metrics show cumulative count of Article Views (full-text article views including HTML views, PDF and ePub downloads, according to the available data) and Abstracts Views on Vision4Press platform.
Data correspond to usage on the plateform after 2015. The current usage metrics is available 48-96 hours after online publication and is updated daily on week days.
Initial download of the metrics may take a while.