Fig. 7.
Download original image
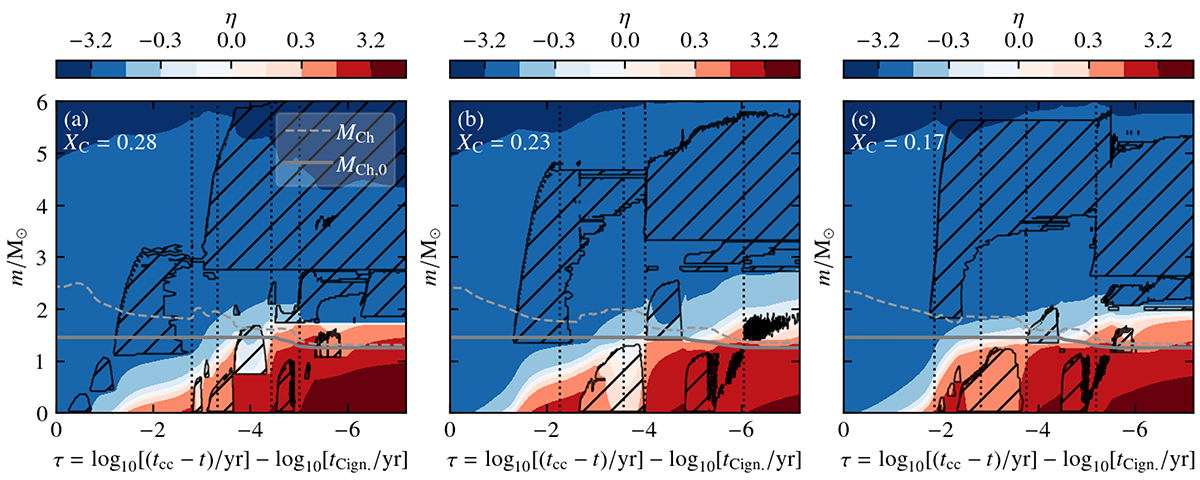
Kippenhahn diagram of the inner 6 M⊙ core structure of models with the same core mass and different core carbon abundance at core C ignition. Colors indicate the dimensionless electron degeneracy parameter η = μ/kBT (electrons are partially degenerate for η ≈ 0 and very degenerate for η ≫ 0). Convective zones are highlighted by the hatched regions and the dotted vertical lines indicate, from left to right, the moments when 12C, 20Ne, 16O, and 28Si are depleted at the center (central abundance lower than 10−4). The gray full and dashed lines indicate the classical (MCh, 0) and effective (MCh) Chandrasekhar mass, respectively. Electron degeneracy during core carbon burning increases for models with lower central carbon abundances.
Current usage metrics show cumulative count of Article Views (full-text article views including HTML views, PDF and ePub downloads, according to the available data) and Abstracts Views on Vision4Press platform.
Data correspond to usage on the plateform after 2015. The current usage metrics is available 48-96 hours after online publication and is updated daily on week days.
Initial download of the metrics may take a while.